Fig. B.1.
Download original image
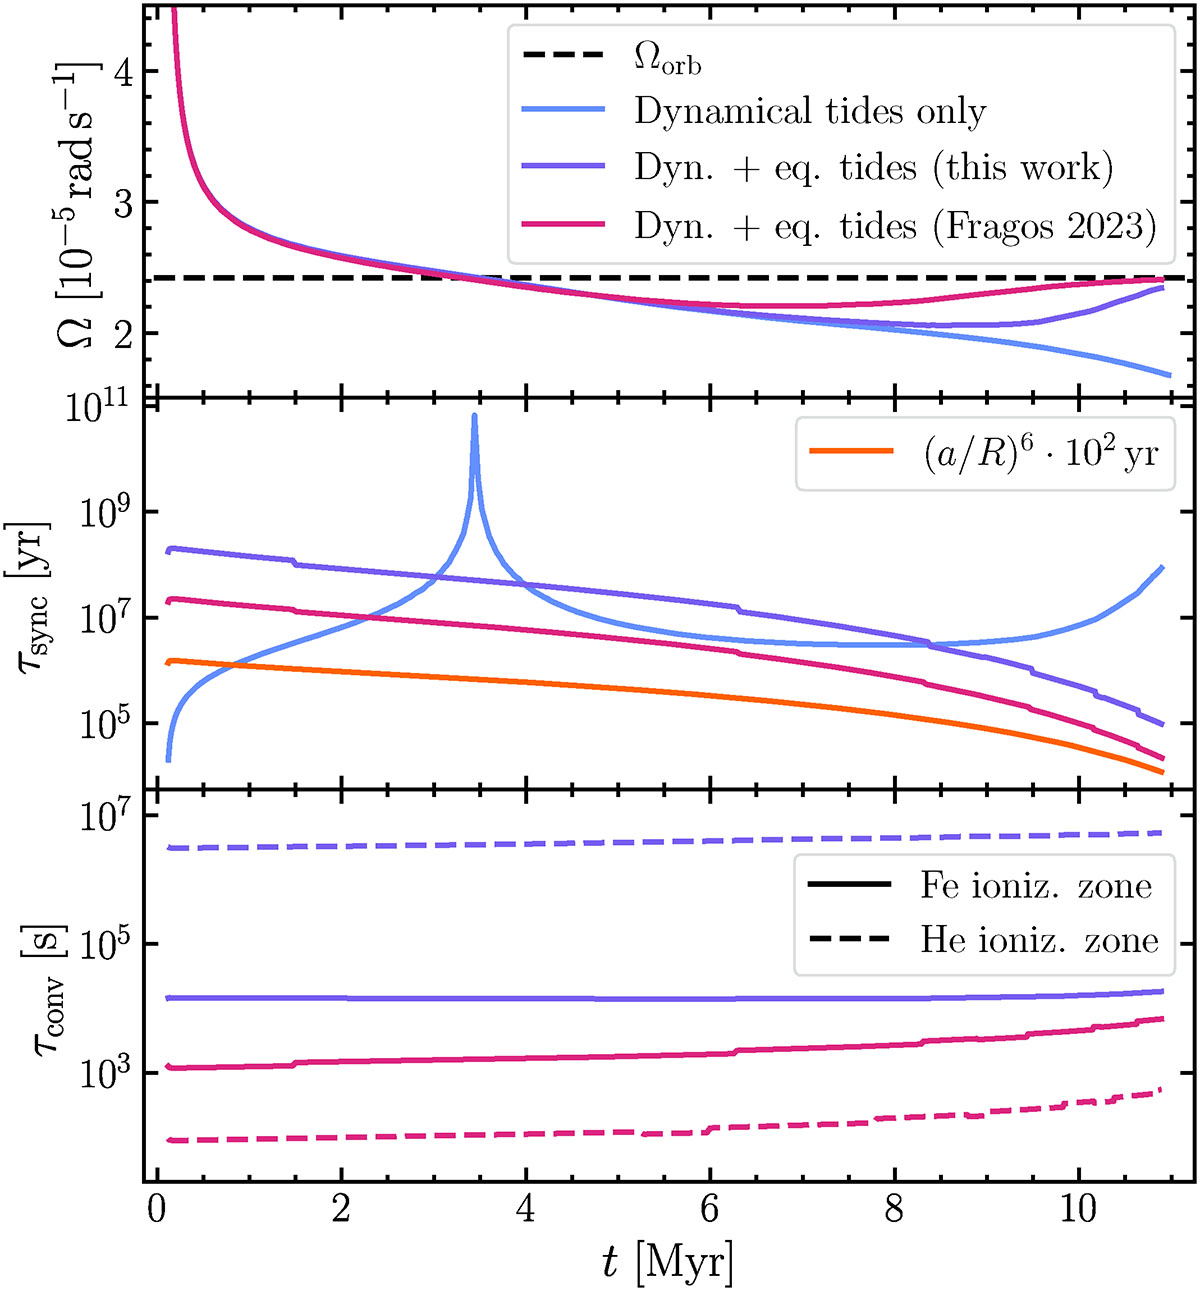
Evolution toward synchronization of the same system as in Sciarini et al. (2024) with P = 3 days including model variations accounting for the equilibrium tides. Upper panel: Angular velocity. Middle panel: Synchronization timescales (the different lines correspond to the dynamical tides and equilibrium tides synchronization timescales, not the "global" synchronization timescales of each computed model). Lower panel: Convective turnover timescales.
Current usage metrics show cumulative count of Article Views (full-text article views including HTML views, PDF and ePub downloads, according to the available data) and Abstracts Views on Vision4Press platform.
Data correspond to usage on the plateform after 2015. The current usage metrics is available 48-96 hours after online publication and is updated daily on week days.
Initial download of the metrics may take a while.