Fig. 6.
Download original image
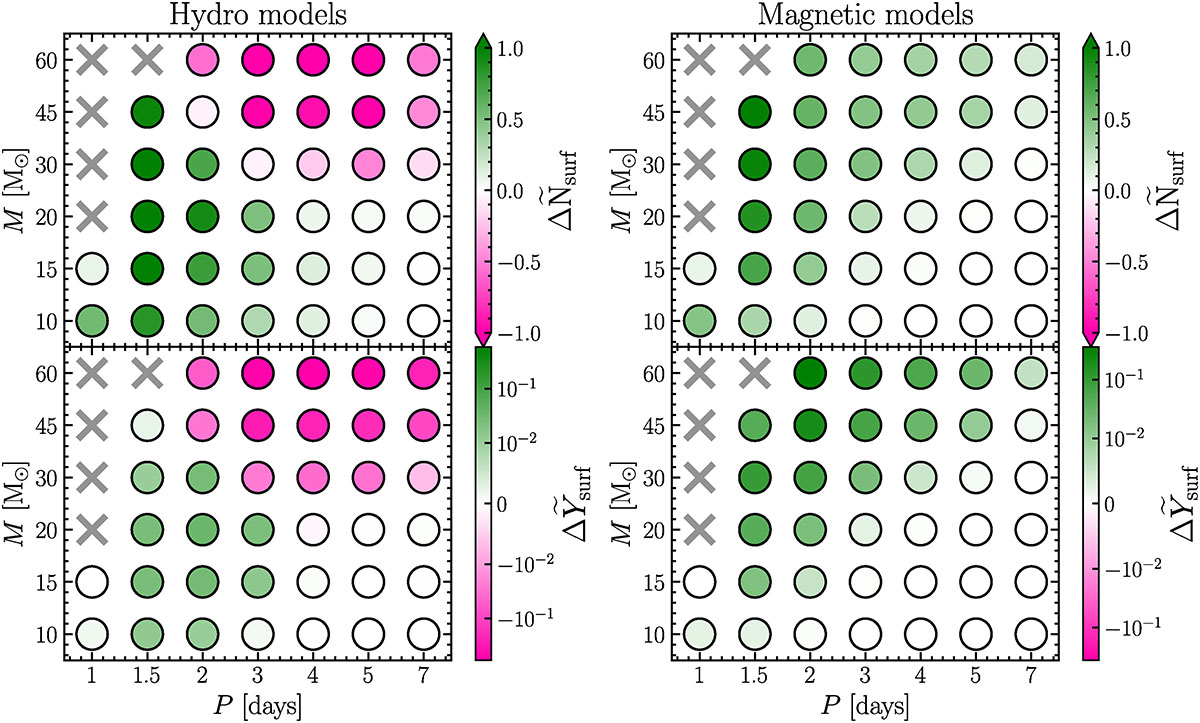
Period-mass diagram comparing the enrichment of binary models initialized at synchronization to those of single-star models with identical initial conditions. The green (magenta) color is used for models with Δ > 0 (Δ < 0). A symmetric colorbar is used to illustrate the magnitude of the difference in enrichment. Models with Δ ∼ 0 appear in white. Left panels: Hydro models. Right panels: Magnetic models. Upper panels: Nitrogen enrichment. Lower panels: Helium enrichment. Systems overfilling their RL at ZAMS are represented by gray crosses.
Current usage metrics show cumulative count of Article Views (full-text article views including HTML views, PDF and ePub downloads, according to the available data) and Abstracts Views on Vision4Press platform.
Data correspond to usage on the plateform after 2015. The current usage metrics is available 48-96 hours after online publication and is updated daily on week days.
Initial download of the metrics may take a while.