Fig. A.3
Download original image
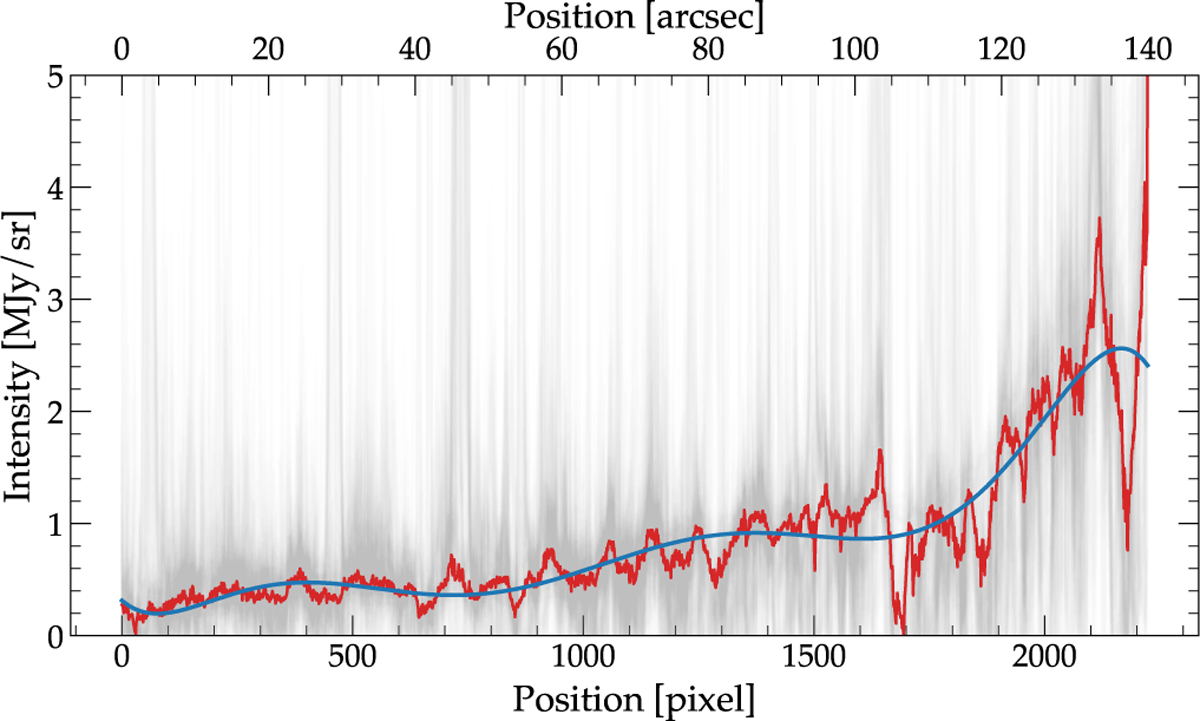
Intensity gradient along the spike to the east of Merope. In gray are all the individual longitudinal profiles within a 150-pixel-wide box around the spike, after subtraction of the diffuse background estimate and normalization across the spike (see text for details). The 2σ-clipped median profile is plotted in red, and the fit to the median using a seventh-order polynomial function is plotted in blue.
Current usage metrics show cumulative count of Article Views (full-text article views including HTML views, PDF and ePub downloads, according to the available data) and Abstracts Views on Vision4Press platform.
Data correspond to usage on the plateform after 2015. The current usage metrics is available 48-96 hours after online publication and is updated daily on week days.
Initial download of the metrics may take a while.