Open Access
Fig. A.4
Download original image
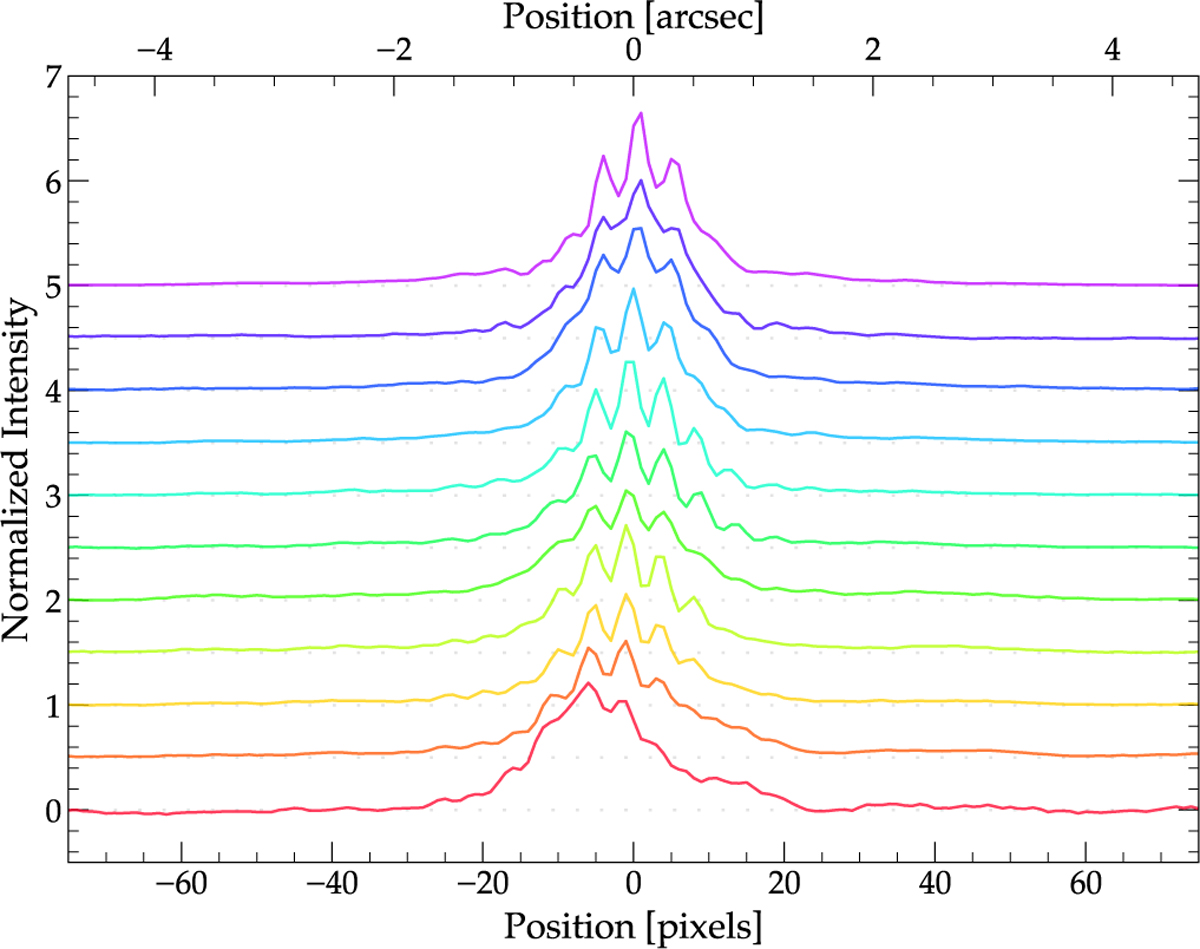
Emission profiles across the spike at multiple positions along the spike (every 200 pixels, or about 12.6′′). Each profile is offset by 0.5 with respect to the previous one. The top profile is that closest to Merope.
Current usage metrics show cumulative count of Article Views (full-text article views including HTML views, PDF and ePub downloads, according to the available data) and Abstracts Views on Vision4Press platform.
Data correspond to usage on the plateform after 2015. The current usage metrics is available 48-96 hours after online publication and is updated daily on week days.
Initial download of the metrics may take a while.