Fig. A.8
Download original image
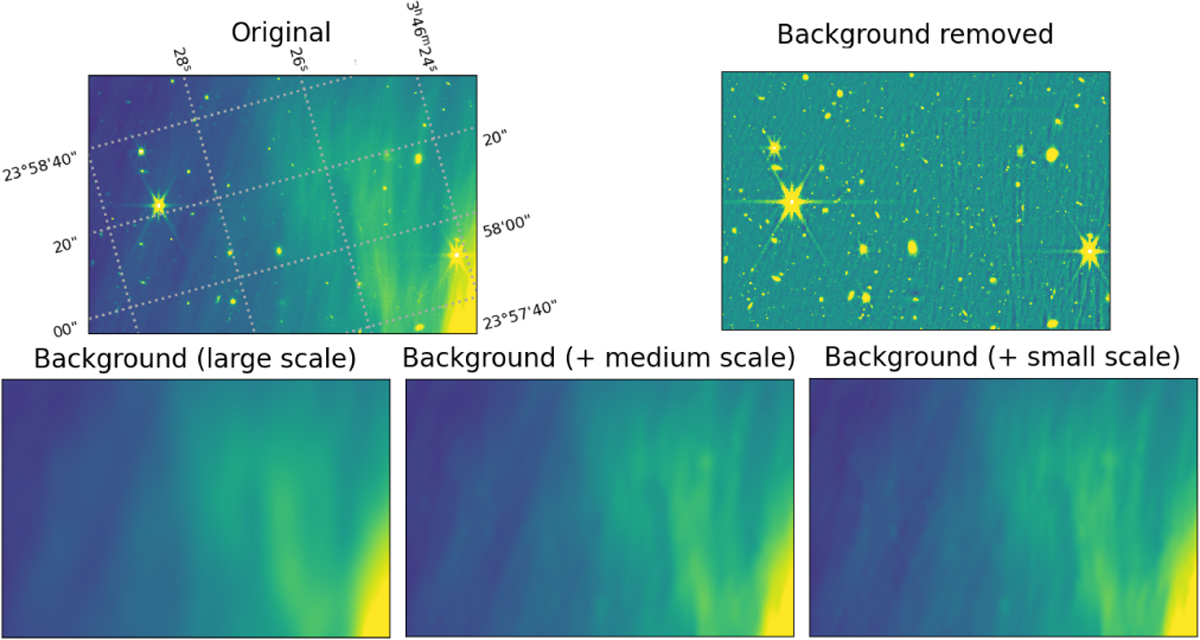
Images illustrating the multi-scale composition of the background map on a sub-image within Field 1. From the top left and going anticlockwise, the five panels show: the sub-image with the spikes removed; the background map at 100-pixel scale including the global mean; the previous map with the addition of the 40-pixel scale background; the previous map with the addition of the 25-pixel scale background; and the residual image obtained by subtracting the multiscale background from the original image. The color scale ranges from 0.35 to 0.95 MJy/sr except for the top-right panel, where it ranges from −0.05 to 0.05 MJy/sr. A nonlinear color scaling is used to enhance the low-surface-brightness features in the field.
Current usage metrics show cumulative count of Article Views (full-text article views including HTML views, PDF and ePub downloads, according to the available data) and Abstracts Views on Vision4Press platform.
Data correspond to usage on the plateform after 2015. The current usage metrics is available 48-96 hours after online publication and is updated daily on week days.
Initial download of the metrics may take a while.