Fig. A.9
Download original image
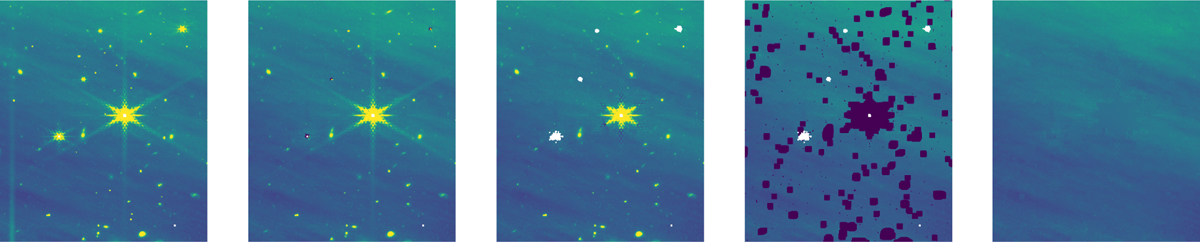
Images illustrating steps in the data cleaning on a sub-image of Field 1. From left to right: the initial image, which includes the spike of PQ Tau close to the image edge to the left; the image after the spike from PQ Tau and the in-field stars have been subtracted via the ePSF method (four stars mostly in the top half of the image); the subsequent image obtained by masking the cores of the point sources; the same region after we mask all pixels that correspond to galaxies, faint stars, and hot pixels; and the diffuse emission map.
Current usage metrics show cumulative count of Article Views (full-text article views including HTML views, PDF and ePub downloads, according to the available data) and Abstracts Views on Vision4Press platform.
Data correspond to usage on the plateform after 2015. The current usage metrics is available 48-96 hours after online publication and is updated daily on week days.
Initial download of the metrics may take a while.