Fig. 2
Download original image
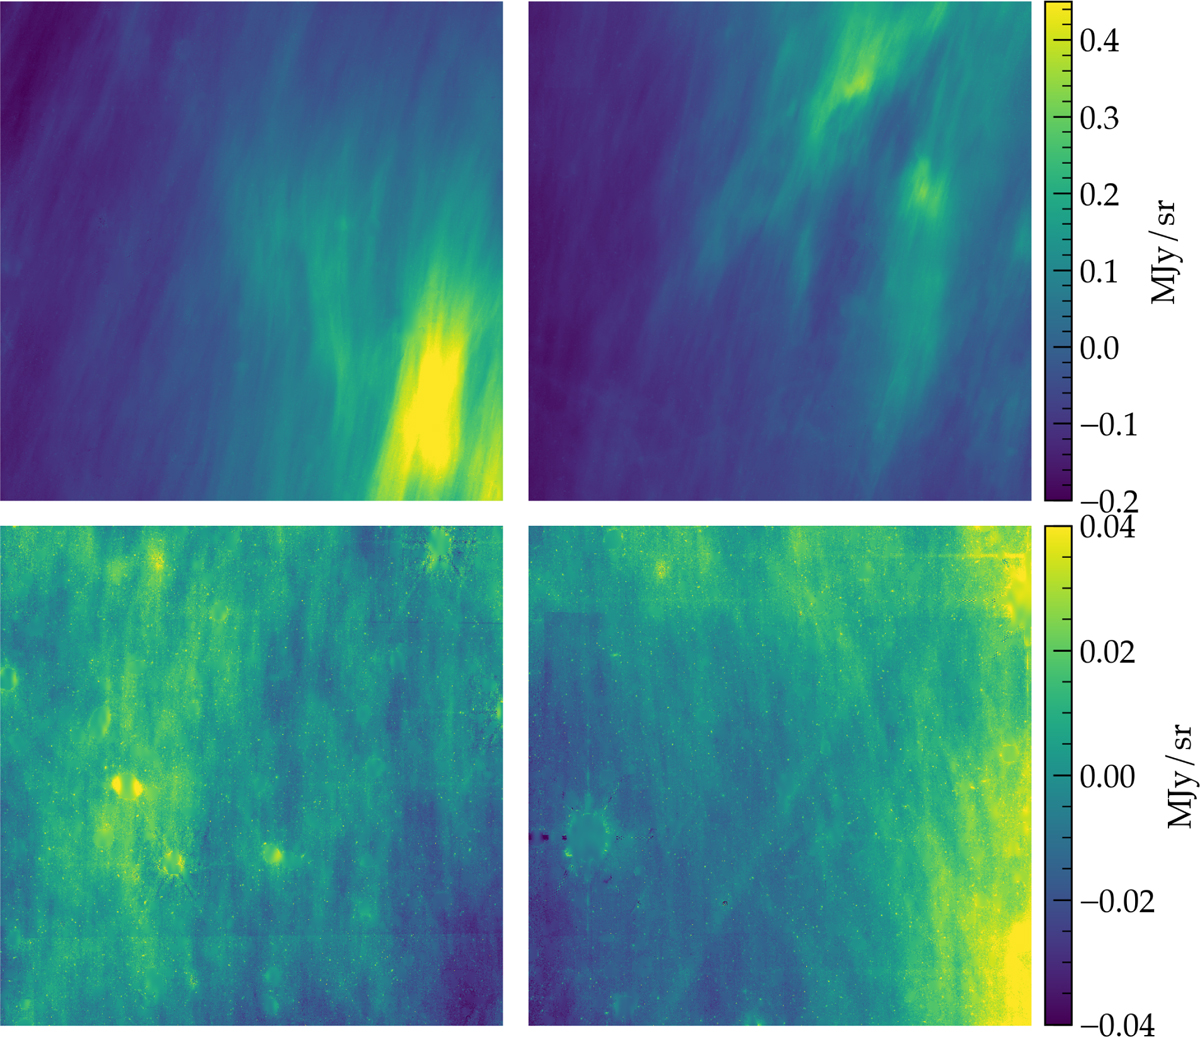
JWST images of diffuse sky emission. The panels show the average image of the four pairs we analyzed; the top row shows Field 1 images, and the bottom row Field 2 images. The Cut 1 images are to the left and the Cut 2 images to the right. The mean values of each image are set to zero. The center positions and the position angles of the vertical axes of the images can be found in Table 1.
Current usage metrics show cumulative count of Article Views (full-text article views including HTML views, PDF and ePub downloads, according to the available data) and Abstracts Views on Vision4Press platform.
Data correspond to usage on the plateform after 2015. The current usage metrics is available 48-96 hours after online publication and is updated daily on week days.
Initial download of the metrics may take a while.