Fig. B.1
Download original image
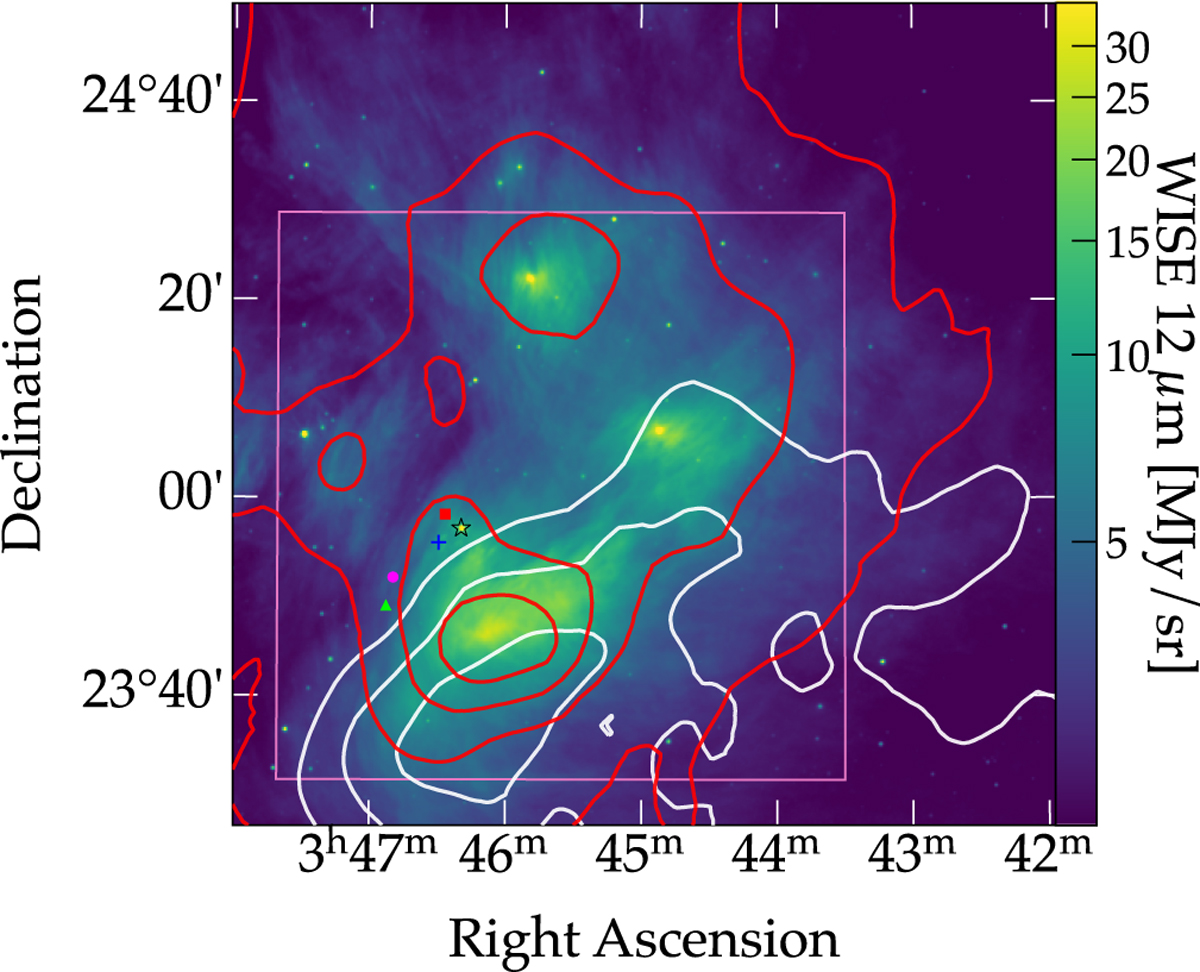
Dust temperature and opacity maps overlaid on the 12 μm WISE image at full angular resolution. The dust opacity at 353 GHz and the dust temperature, as derived from the analysis of Planck data, are shown with white contours for τ353 = 2, 3, and 4 × 10⁻⁵ in and red contours for Td = 20, 23, 26, and 29 K. Merope is marked with a star, the centers of the JWST images with a red square, Field 1 Cuts 1 and 2 with a blue plus sign, and Field 2 Cuts 1 and 2 with a purple circle and a green triangle. The pink box displays the location of the image of dust polarization angles presented in Fig. B.2.
Current usage metrics show cumulative count of Article Views (full-text article views including HTML views, PDF and ePub downloads, according to the available data) and Abstracts Views on Vision4Press platform.
Data correspond to usage on the plateform after 2015. The current usage metrics is available 48-96 hours after online publication and is updated daily on week days.
Initial download of the metrics may take a while.