Fig. 3
Download original image
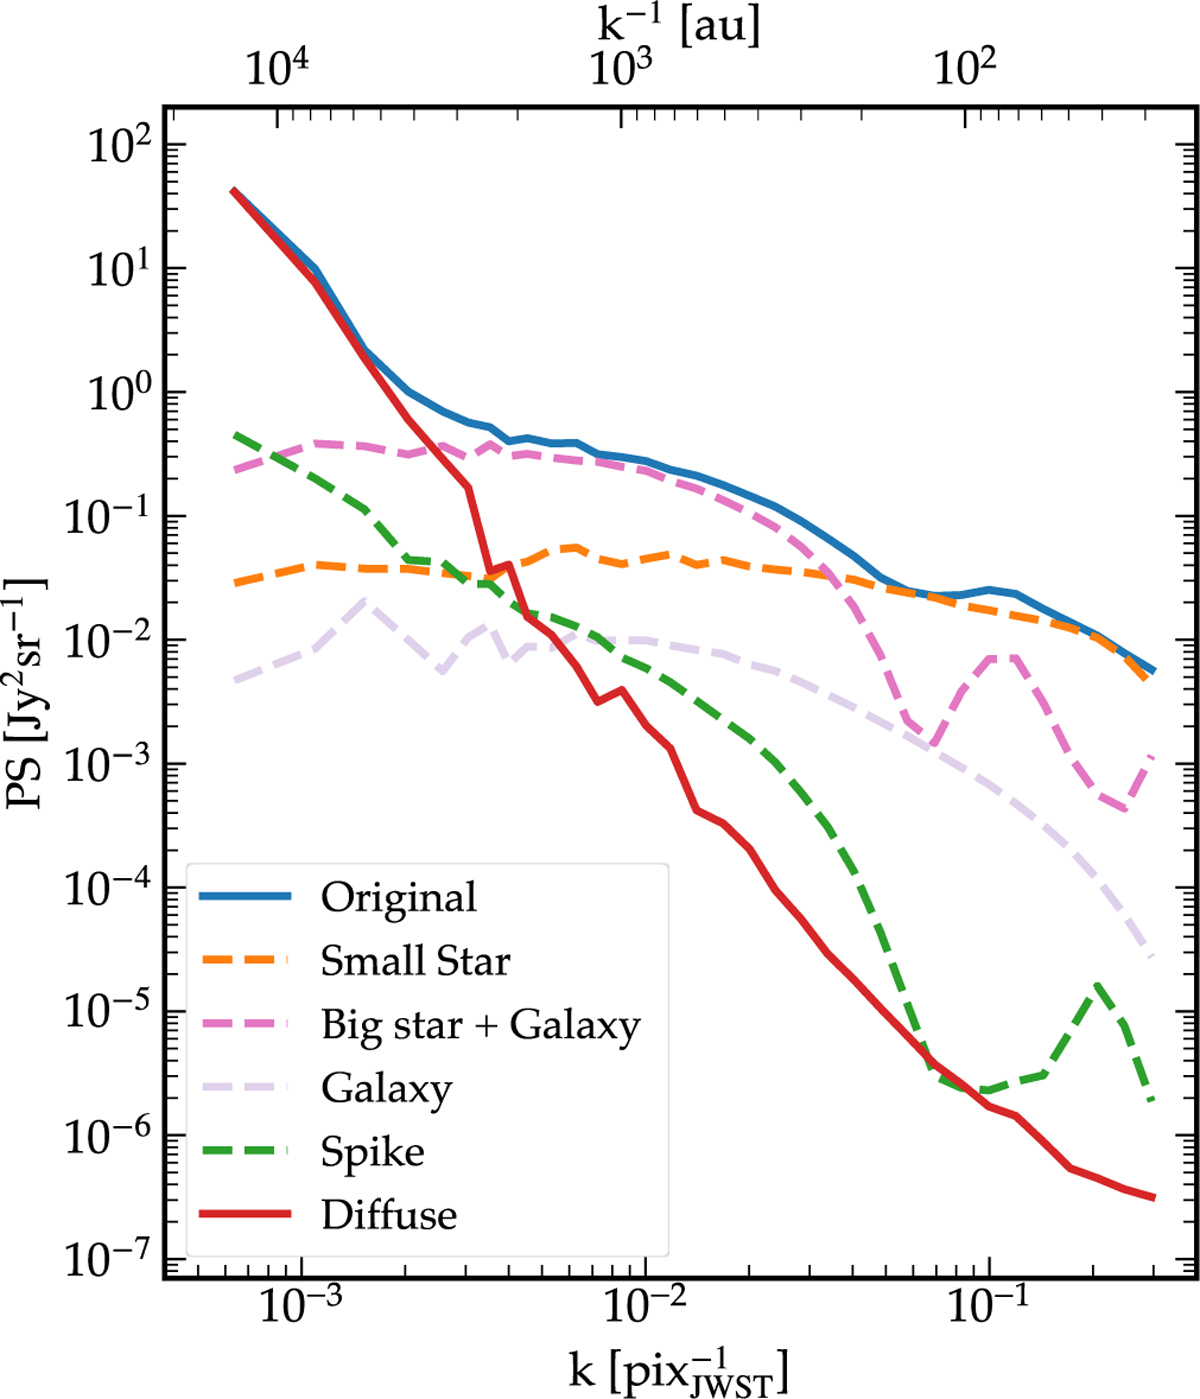
Power spectra of Field 1 Cut 1 at different steps of the data cleaning. The top spectrum is that of the initial JWST image with the stars, their spikes, and galaxies. The bottom is that of the image at the end of cleaning. The dashed lines show the spectra of the maps of stars, spikes, and galaxies subtracted from the JWST image. The wavenumber is expressed in units of pix ![]() on the bottom axis and au on the top axis.
on the bottom axis and au on the top axis.
Current usage metrics show cumulative count of Article Views (full-text article views including HTML views, PDF and ePub downloads, according to the available data) and Abstracts Views on Vision4Press platform.
Data correspond to usage on the plateform after 2015. The current usage metrics is available 48-96 hours after online publication and is updated daily on week days.
Initial download of the metrics may take a while.