Open Access
Fig. 4
Download original image
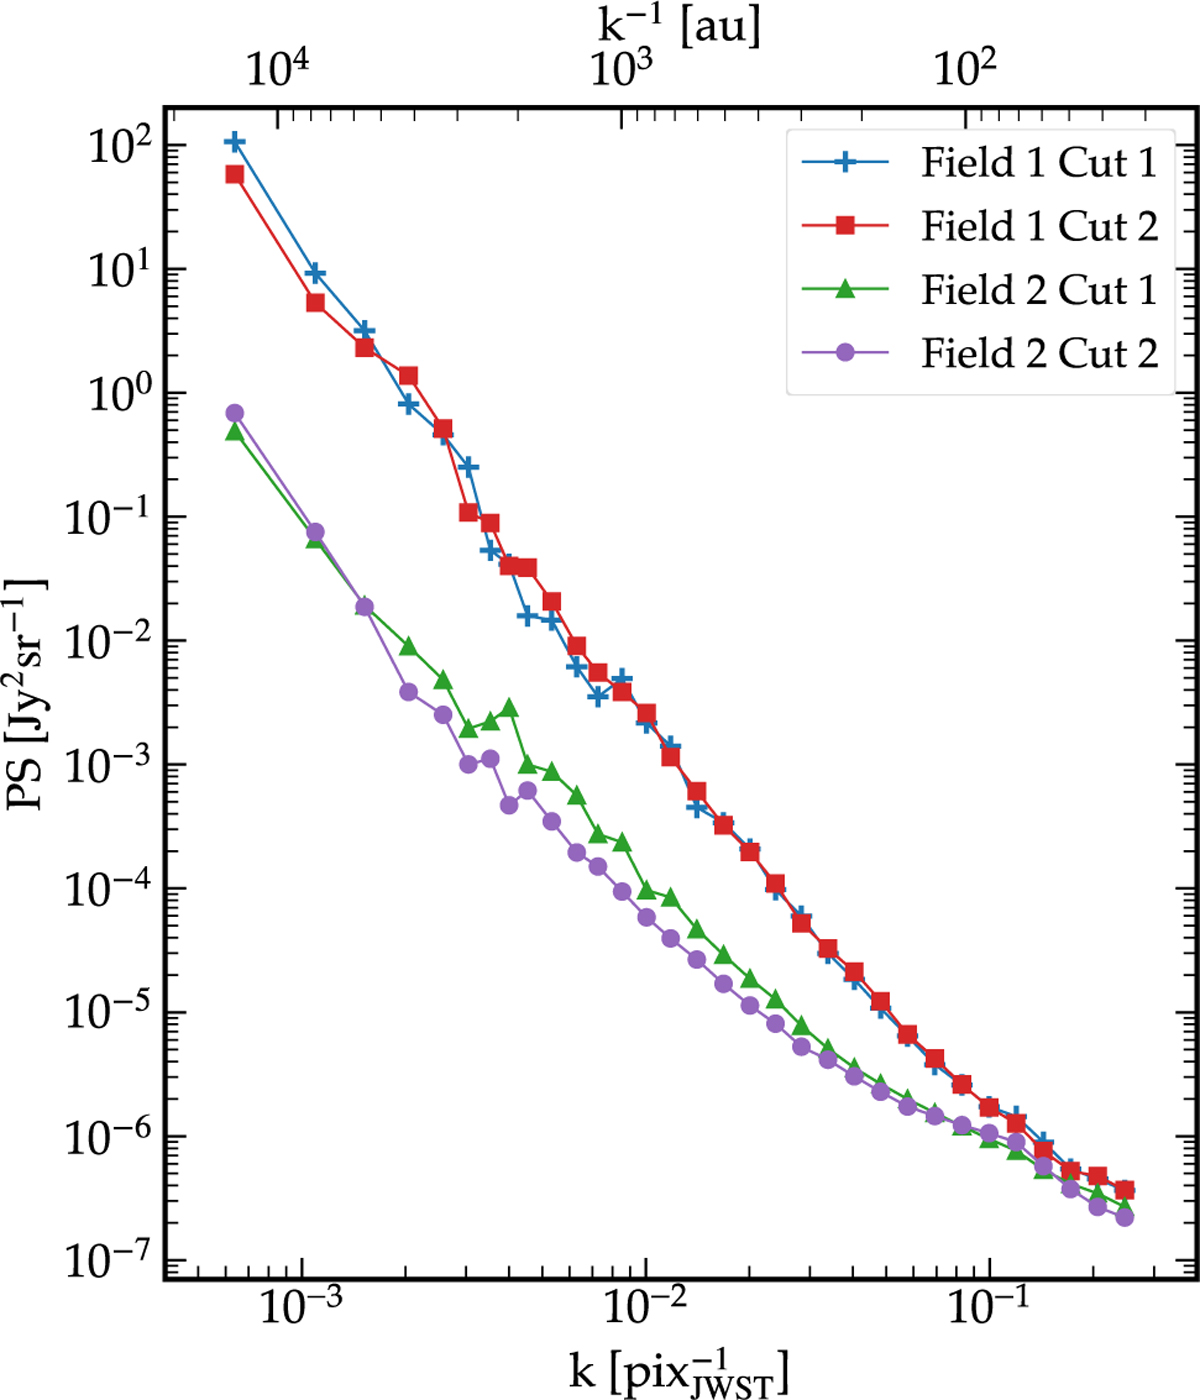
Cross-power spectra for the four JWST images. Distinct colors and symbols identify the spectra of the images listed in the top-right corner. The spectra are corrected for beam attenuation. Due to the large dynamic range of the four spectra, the statistical error bars are too small to be visible on the plot.
Current usage metrics show cumulative count of Article Views (full-text article views including HTML views, PDF and ePub downloads, according to the available data) and Abstracts Views on Vision4Press platform.
Data correspond to usage on the plateform after 2015. The current usage metrics is available 48-96 hours after online publication and is updated daily on week days.
Initial download of the metrics may take a while.