Fig. 5
Download original image
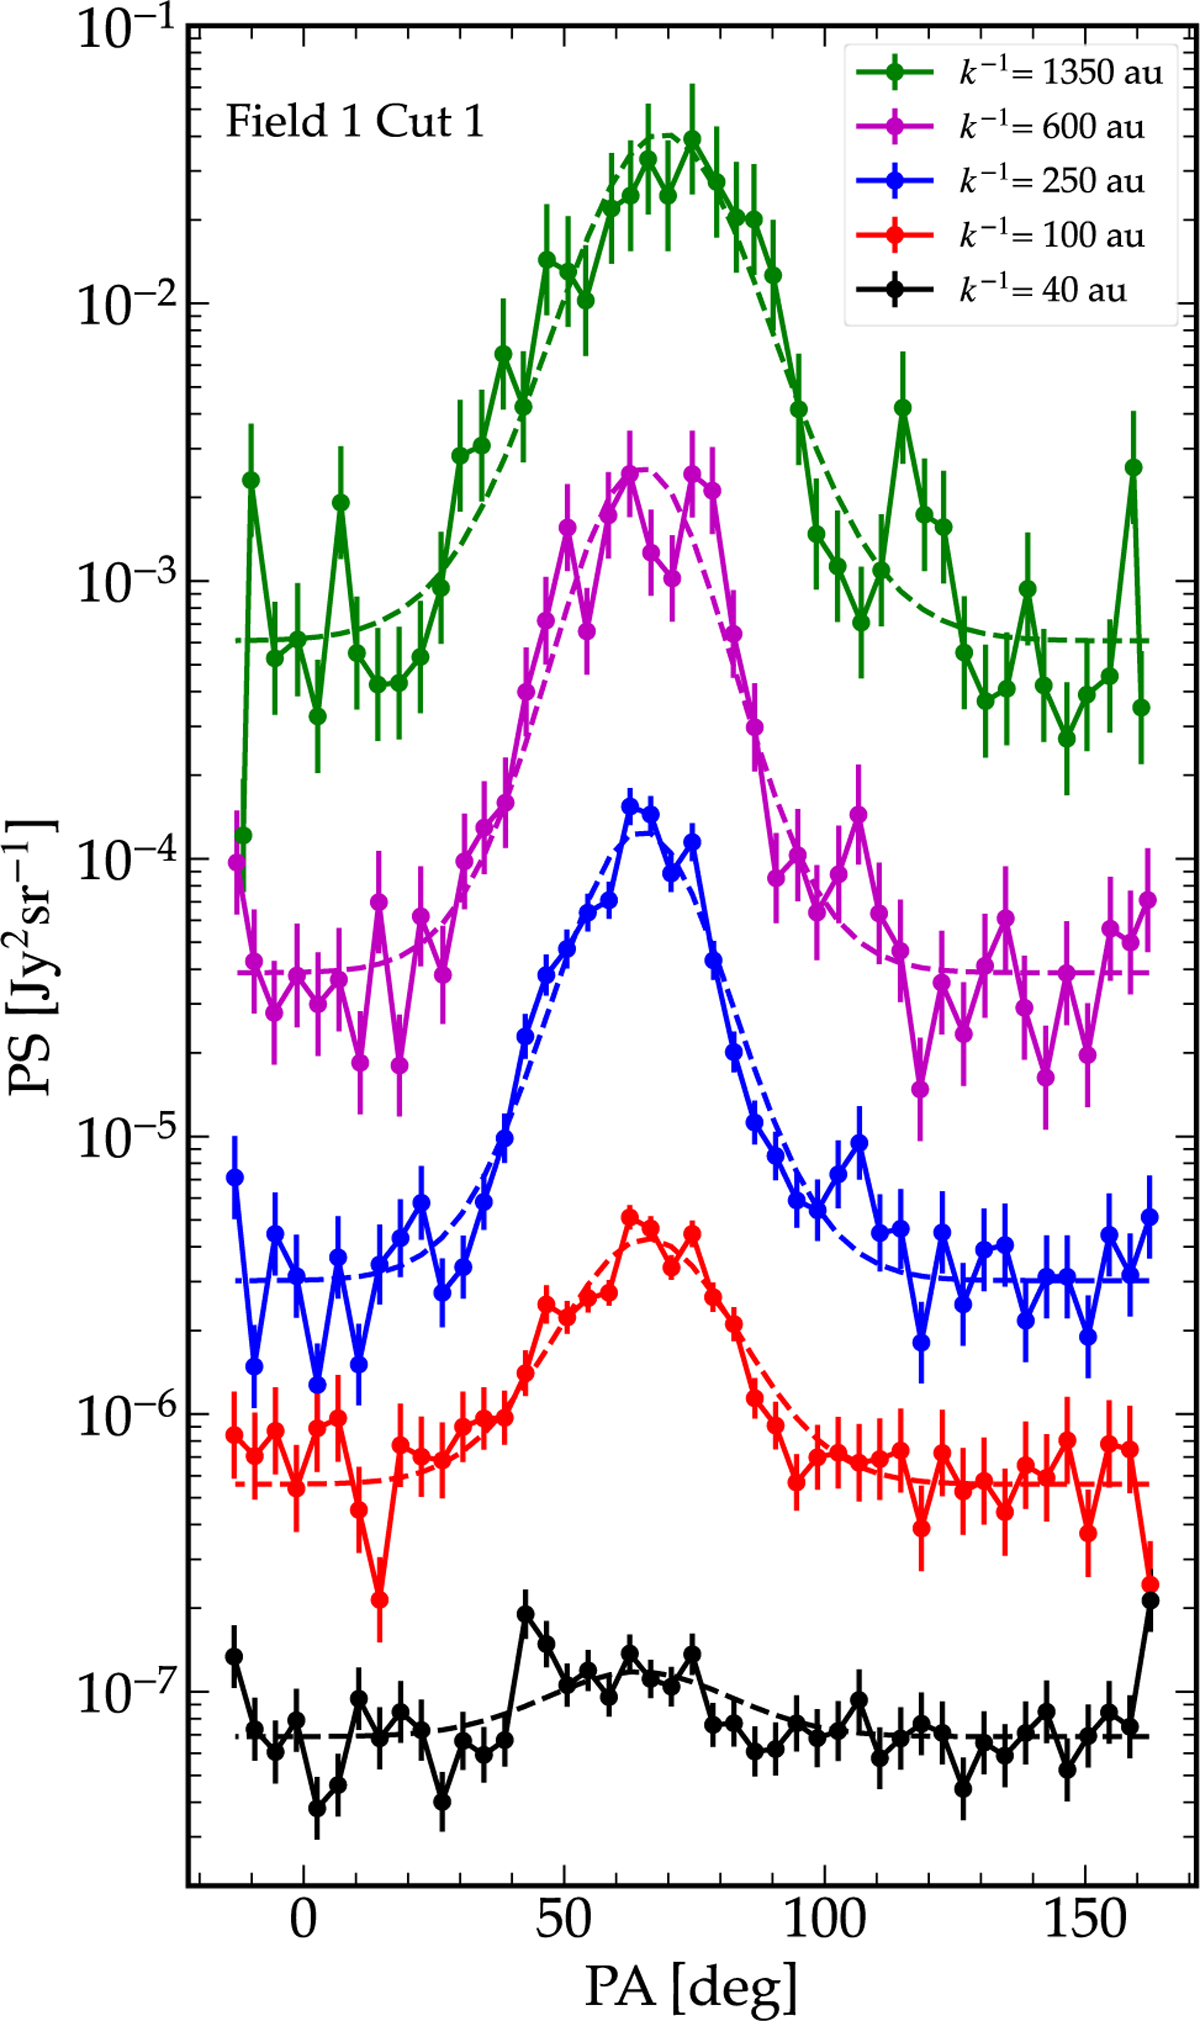
Angular dependence of the power spectrum amplitude for the Field 1 image Cut 1. The angular dependence is plotted for the 5 k values listed in the top-right corner. The position angle (horizontal axis) is measured modulo π with respect to the celestial north and positive to the east. The dashed lines show the fits of the Gaussian model in Eq. (5) to the profiles.
Current usage metrics show cumulative count of Article Views (full-text article views including HTML views, PDF and ePub downloads, according to the available data) and Abstracts Views on Vision4Press platform.
Data correspond to usage on the plateform after 2015. The current usage metrics is available 48-96 hours after online publication and is updated daily on week days.
Initial download of the metrics may take a while.