Open Access
Fig. 9
Download original image
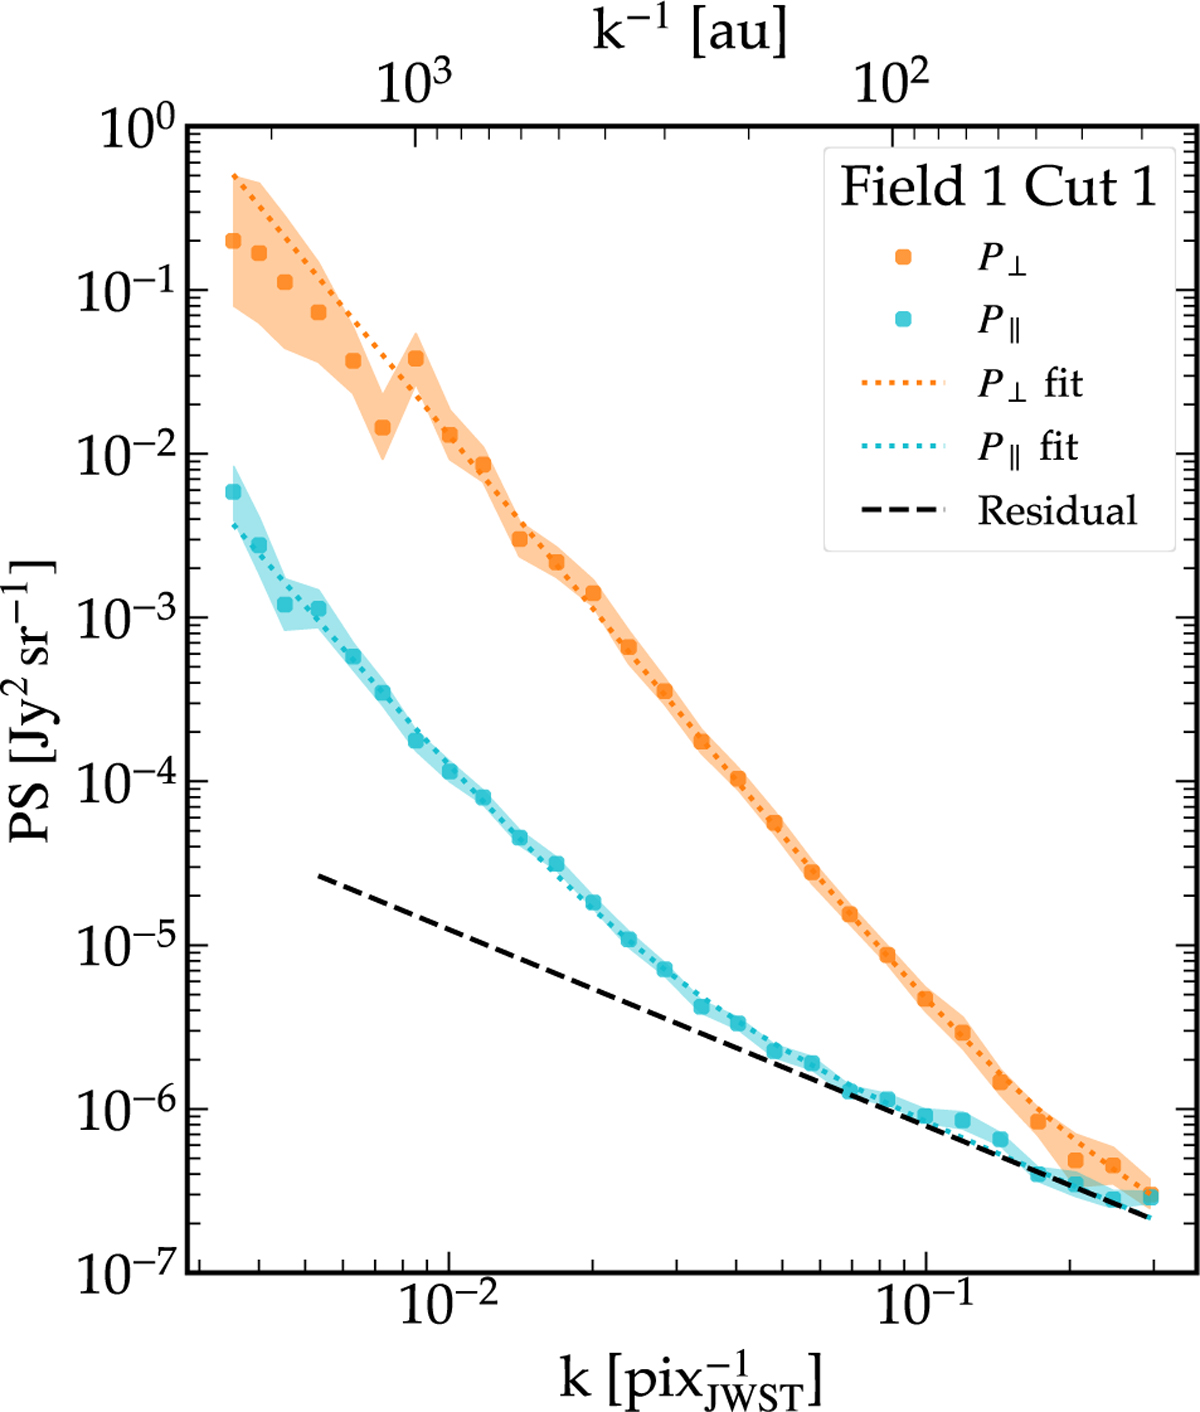
Fit with two power laws of P⊥ and P‖ for the Field 1 image Cut 1. The dotted orange and cyan lines represent the data fits of P⊥ and P‖, respectively, while the dashed black line represents the power-law fit of the CIB residual. The shaded areas around the data points indicate the 1σ error bars of the spectra.
Current usage metrics show cumulative count of Article Views (full-text article views including HTML views, PDF and ePub downloads, according to the available data) and Abstracts Views on Vision4Press platform.
Data correspond to usage on the plateform after 2015. The current usage metrics is available 48-96 hours after online publication and is updated daily on week days.
Initial download of the metrics may take a while.