Fig. 10
Download original image
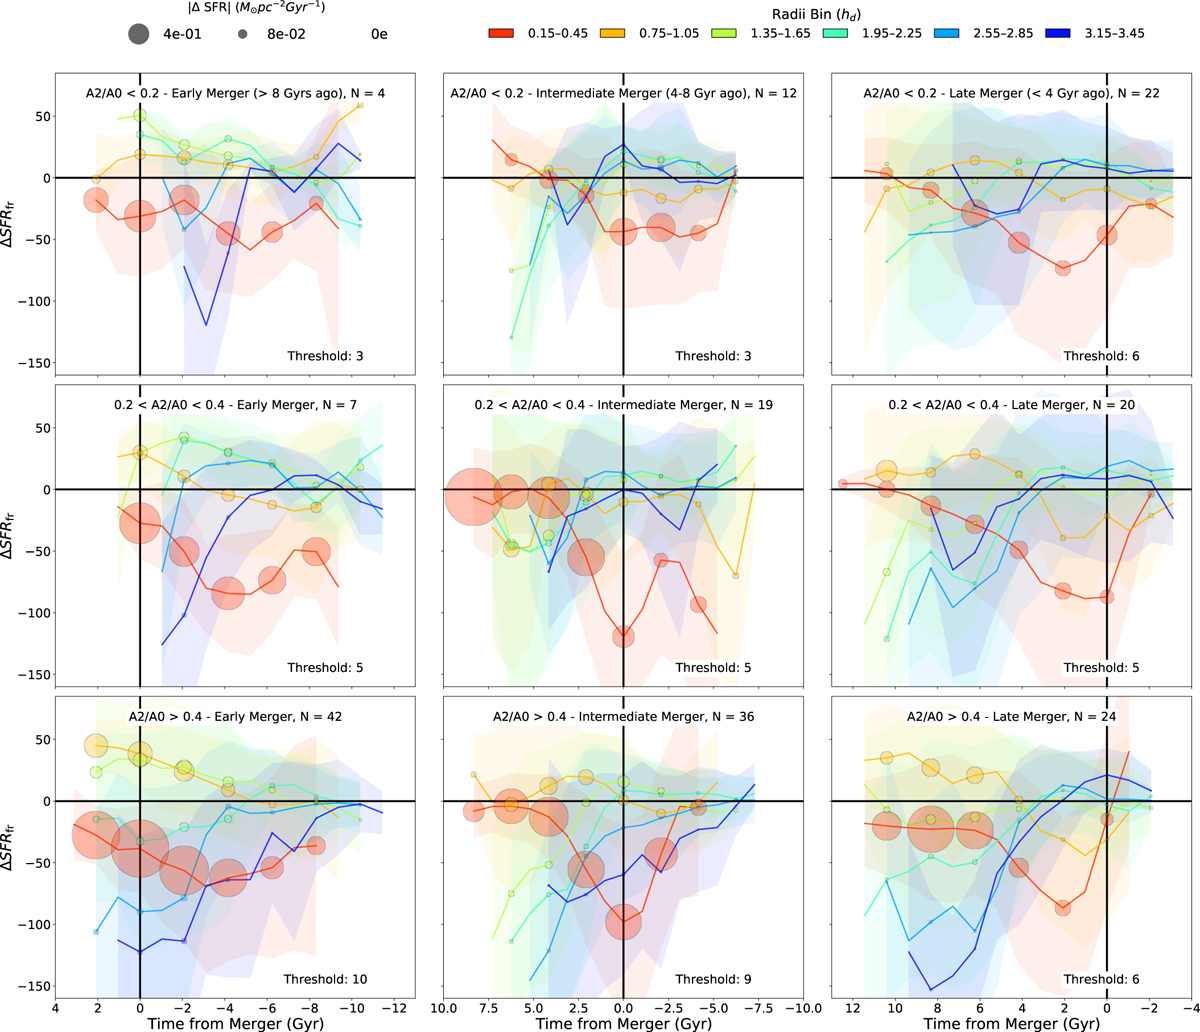
Mean ΔSFRfr for galaxies grouped by bar strength (rows) and merger history (columns), plotted against look-back time for different radial bins. Each column shows a distinct merger epoch: early (>8 Gyr ago), middle (4-8 Gyr ago), and late (<4 Gyr ago). The x-axis is centered on the time of the merger, with 0 marking the merger event. Negative values correspond to look-back time before the merger, and positive values indicate time after the merger, measured in Gyr. Colored lines correspond to six radial bins in units of hd, and shaded circles represent the magnitude of ΔSFR, highlighting the extent of radial migration before and after mergers. A completeness threshold is applied, where a point is shown only if at least 35% of galaxies in that merger history group have nonzero SFRBirth in the corresponding age bin.
Current usage metrics show cumulative count of Article Views (full-text article views including HTML views, PDF and ePub downloads, according to the available data) and Abstracts Views on Vision4Press platform.
Data correspond to usage on the plateform after 2015. The current usage metrics is available 48-96 hours after online publication and is updated daily on week days.
Initial download of the metrics may take a while.