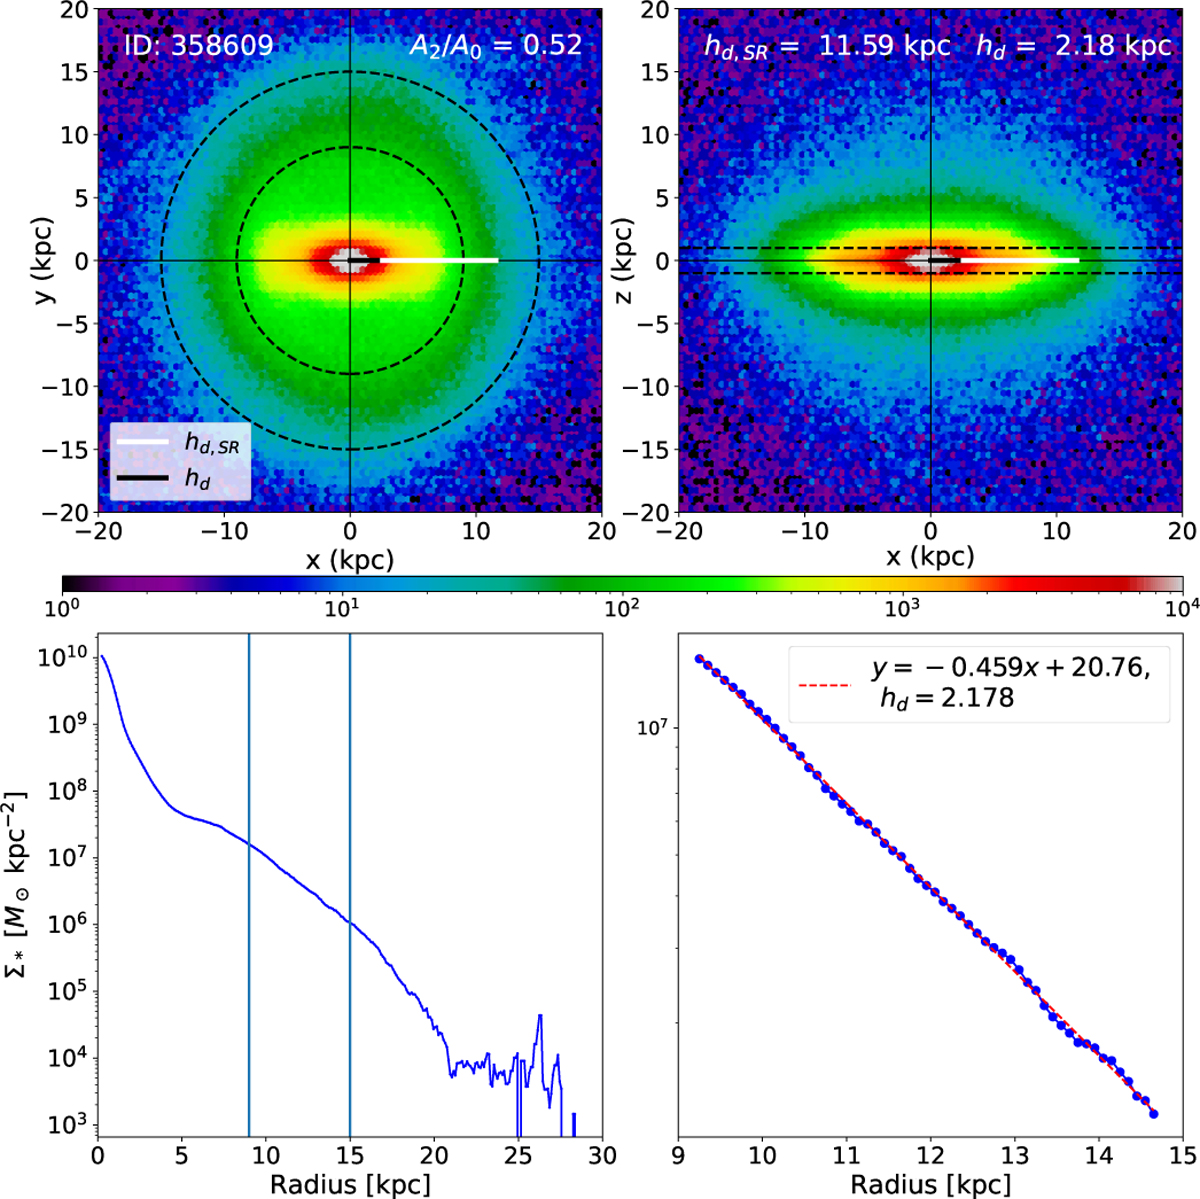
Fig. B.1
Download original image
Example of linear profile fitting for disk scale-length calculation. The top panels show the galaxy face-on (left) and edge-on (right), with white and black lines indicating hd,SR and the hd we measured, respectively. The bottom panels display the surface density profile (Σ*): with vertical lines marking the fitting radius, while the right panel shows the profile within this radius. Our recalculated hd provides a more accurate measurement of the disk scale-length by better excluding bulge-dominated regions and outer disk noise.
Current usage metrics show cumulative count of Article Views (full-text article views including HTML views, PDF and ePub downloads, according to the available data) and Abstracts Views on Vision4Press platform.
Data correspond to usage on the plateform after 2015. The current usage metrics is available 48-96 hours after online publication and is updated daily on week days.
Initial download of the metrics may take a while.