Fig. B.2
Download original image
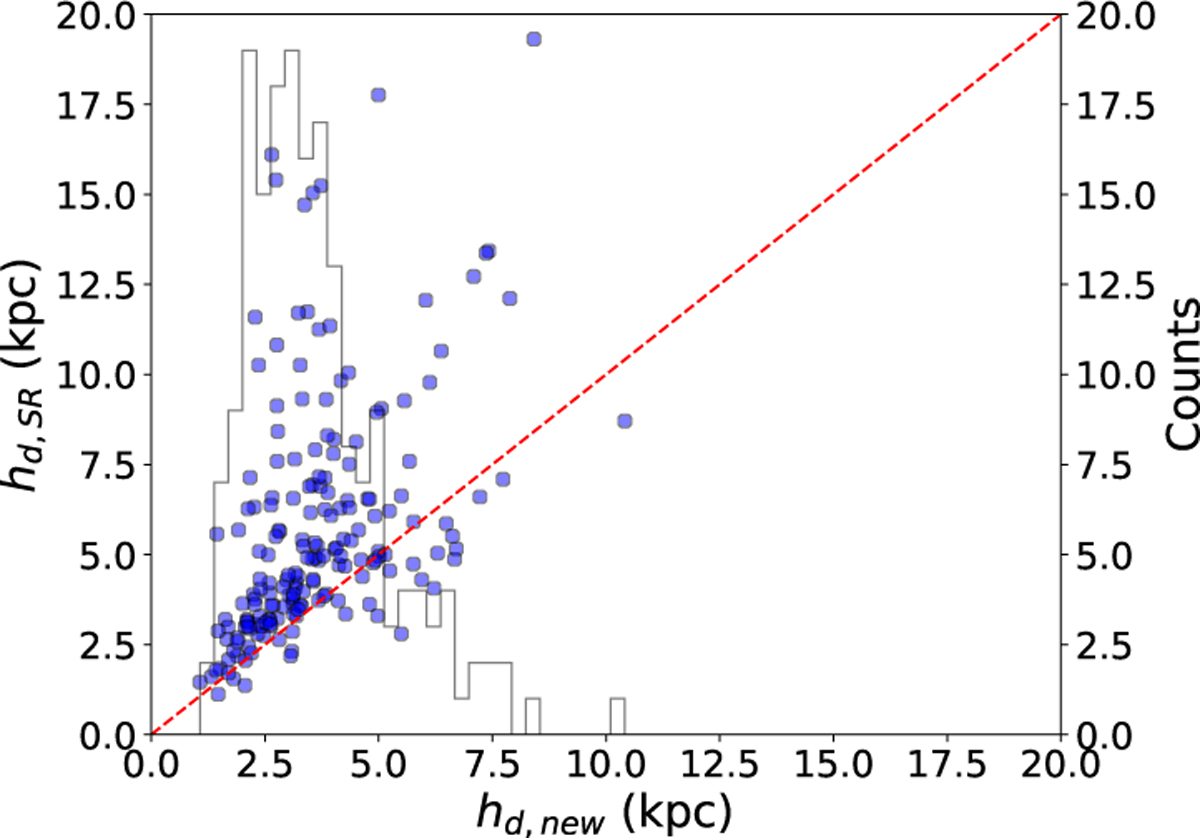
Comparison between the disk scale-lengths hd,SR from Sotillo-Ramos et al. (2022) and our recalculated values hd using individual exponential fits. The red dashed line indicates the 1:1 relation. While both methods show broad agreement at lower values, hd,SR tends to systematically overestimate the disk scale-length compared to our refined measurements. The overestimation becomes more pronounced at larger values. A histogram of hd is shown in gray to indicate the distribution of recalculated values.
Current usage metrics show cumulative count of Article Views (full-text article views including HTML views, PDF and ePub downloads, according to the available data) and Abstracts Views on Vision4Press platform.
Data correspond to usage on the plateform after 2015. The current usage metrics is available 48-96 hours after online publication and is updated daily on week days.
Initial download of the metrics may take a while.