Fig. B.3
Download original image
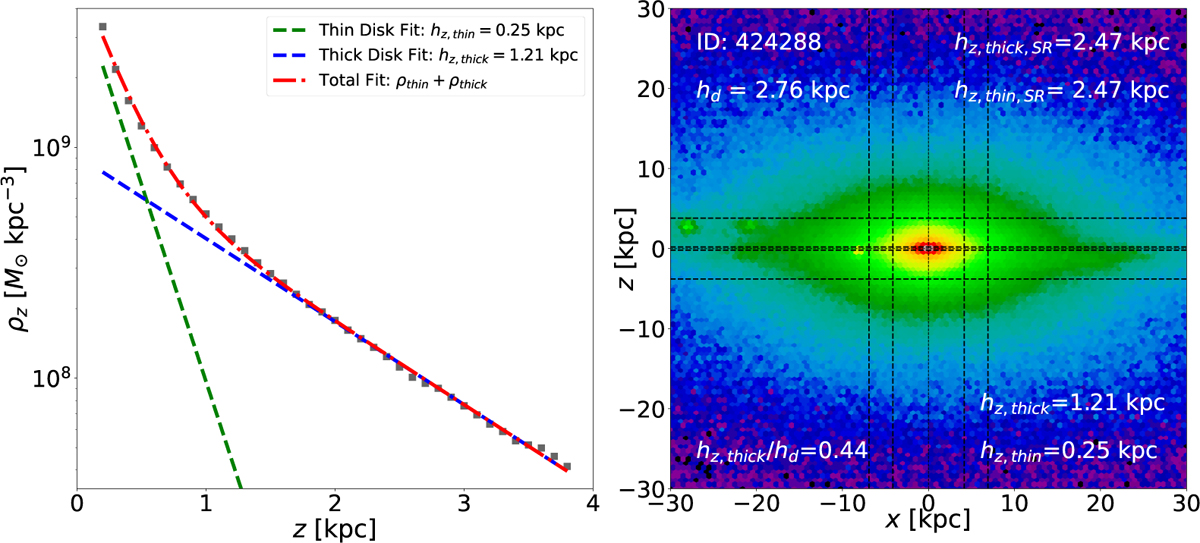
Example of the double exponential profile fitting of the vertical density (ρz) of a galaxy. The left panel shows the thin disk fit (green line), thick disk fit (blue line), total fit (red line), and data points represented by square markers. The right panel displays the edge-on view of the galaxy, with black lines indicating the regions where the fitting was performed.
Current usage metrics show cumulative count of Article Views (full-text article views including HTML views, PDF and ePub downloads, according to the available data) and Abstracts Views on Vision4Press platform.
Data correspond to usage on the plateform after 2015. The current usage metrics is available 48-96 hours after online publication and is updated daily on week days.
Initial download of the metrics may take a while.