Fig. 9
Download original image
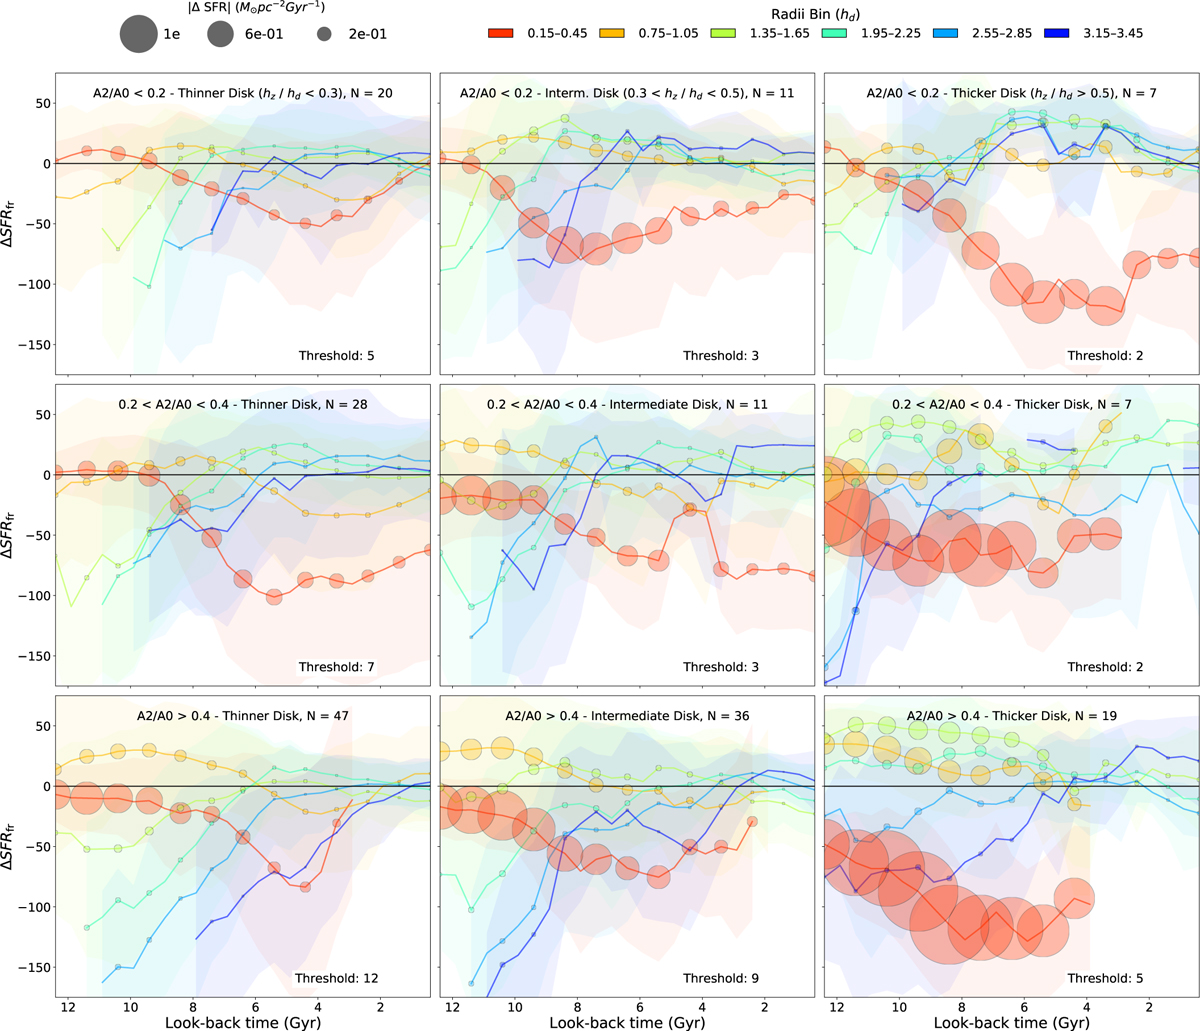
Mean ΔSFRfr for galaxies grouped by bar strength (rows) and disk thickness (columns), shown as a function of look-back time across radial bins. Colored lines represent SFHs in six radial bins (hd), and shaded circles mark the magnitude of ΔSFR, reflecting migration-induced differences between final and birth radii. From left to right, columns correspond to increasing disk thickness, while from top to bottom corresponds to increasing bar strength. A completeness threshold is applied, where a point is shown only if at least 35% of galaxies in that disk thickness group have nonzero SFRBirth in the corresponding age bin.
Current usage metrics show cumulative count of Article Views (full-text article views including HTML views, PDF and ePub downloads, according to the available data) and Abstracts Views on Vision4Press platform.
Data correspond to usage on the plateform after 2015. The current usage metrics is available 48-96 hours after online publication and is updated daily on week days.
Initial download of the metrics may take a while.