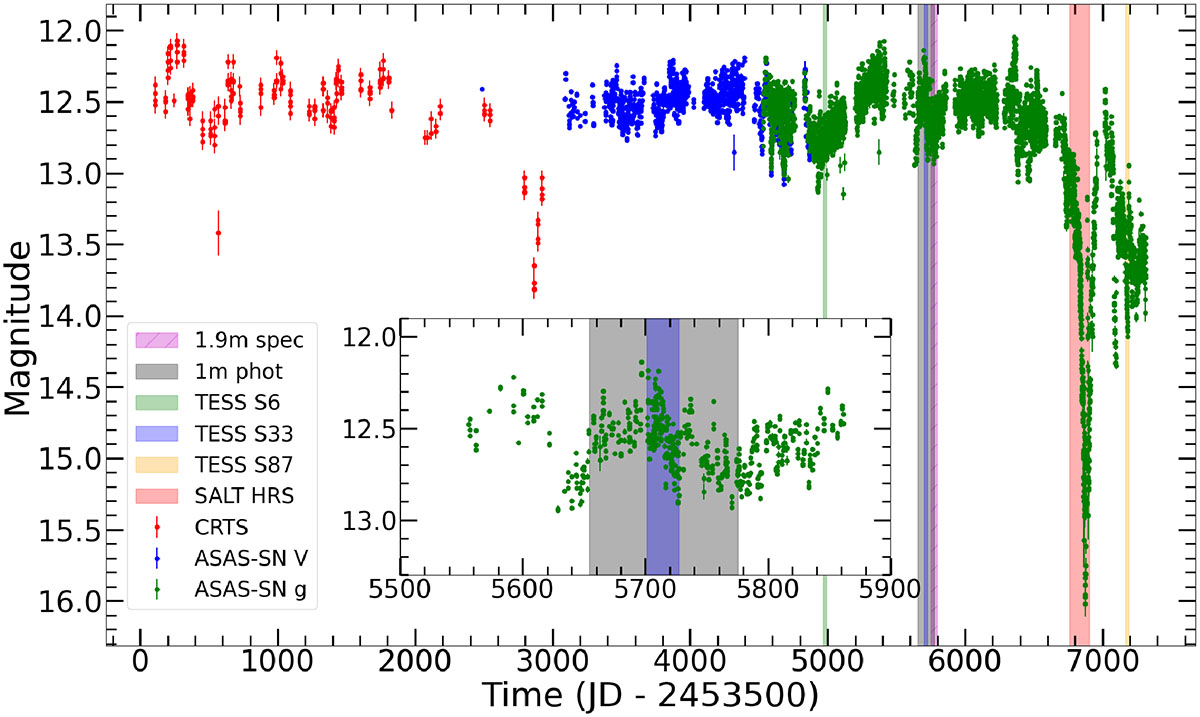
Fig. 1.
Download original image
CRTS V-band (Catalina ID 3027043037227) and ASAS-SN light curve of SRGt 062340 taken using g and V filters. Superimposed are the photometric and spectroscopic observations reported on in this study. Refer to the appendix and text for more detail on observation epochs. The inset plot has the same axes as the main plot, and focuses on the epochs of photometric TESS and SAAO observations. The magnitude ranges from 12.14–12.93 during the SAAO photometry campaign.
Current usage metrics show cumulative count of Article Views (full-text article views including HTML views, PDF and ePub downloads, according to the available data) and Abstracts Views on Vision4Press platform.
Data correspond to usage on the plateform after 2015. The current usage metrics is available 48-96 hours after online publication and is updated daily on week days.
Initial download of the metrics may take a while.