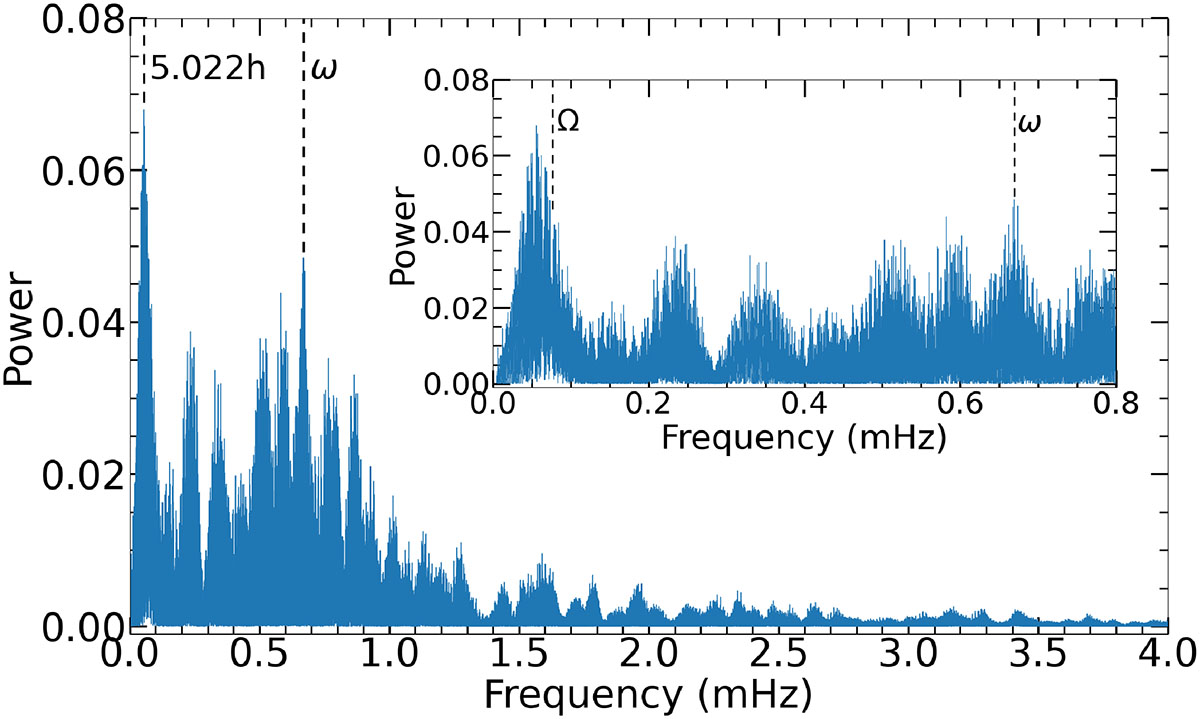
Fig. 10.
Download original image
Lomb-Scargle power spectrum using all the clear filter photometric observations. The frequency of the strongest peak coincides with a period of 5.022 hours. The probable spin frequency of the WD is indicated by the dashed line labelled ω. The inset plot focuses on the region 0.0–0.8 mHz and show the position of the spectroscopic orbital period, Ω, and the probable spin frequency.
Current usage metrics show cumulative count of Article Views (full-text article views including HTML views, PDF and ePub downloads, according to the available data) and Abstracts Views on Vision4Press platform.
Data correspond to usage on the plateform after 2015. The current usage metrics is available 48-96 hours after online publication and is updated daily on week days.
Initial download of the metrics may take a while.