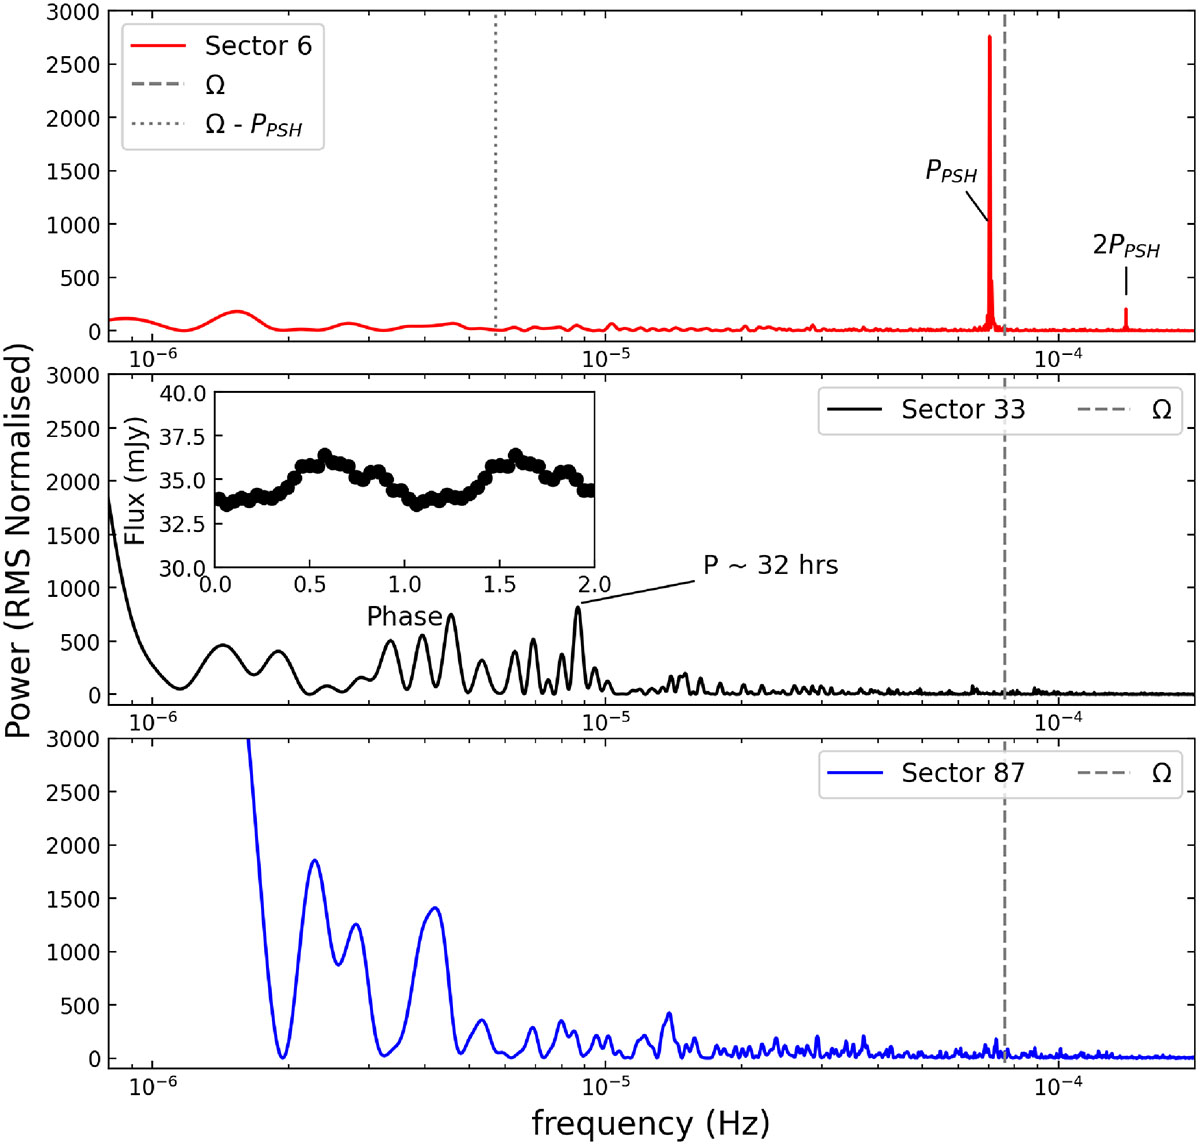
Fig. 12.
Download original image
TESS Sector 6 (top), Sector 33 (middle) and Sector 87 (bottom) power spectra. The 3.941-hour period (PPSH) is indicated in the Sector 6 plot together with the first harmonic (2PPSH). The Sector 33 plot indicates the low frequency signal at ∼32 hours, with an inset plot showing the phase-folded light curve on this period. The dashed line indicates the spectroscopic period of 3.645 hours associated with the orbital period.
Current usage metrics show cumulative count of Article Views (full-text article views including HTML views, PDF and ePub downloads, according to the available data) and Abstracts Views on Vision4Press platform.
Data correspond to usage on the plateform after 2015. The current usage metrics is available 48-96 hours after online publication and is updated daily on week days.
Initial download of the metrics may take a while.