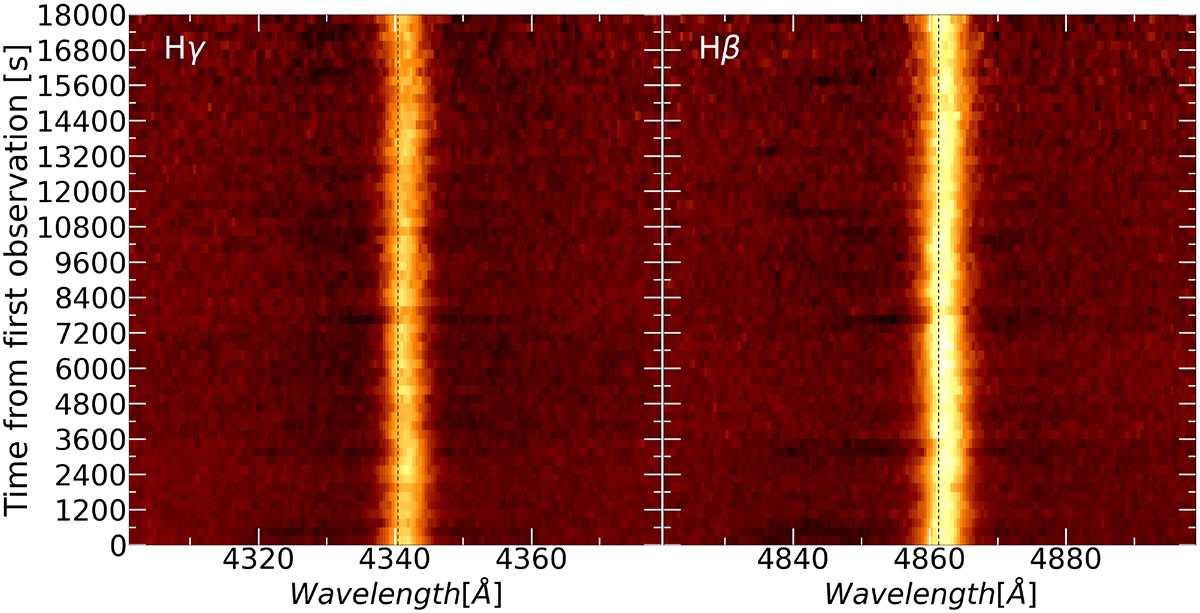
Fig. B.1.
Download original image
Trailed spectra of Hγ (left) and Hβ (right) from 2021 February 27. The vertical dashed black lines coincide with the respective rest wavelengths, which show that the peak of the emission lines lie slightly towards longer wavelengths. Note the wider darker regions of the absorption lines, adjacent to both sides of the bright emission lines, and the sporadic stronger absorption.
Current usage metrics show cumulative count of Article Views (full-text article views including HTML views, PDF and ePub downloads, according to the available data) and Abstracts Views on Vision4Press platform.
Data correspond to usage on the plateform after 2015. The current usage metrics is available 48-96 hours after online publication and is updated daily on week days.
Initial download of the metrics may take a while.