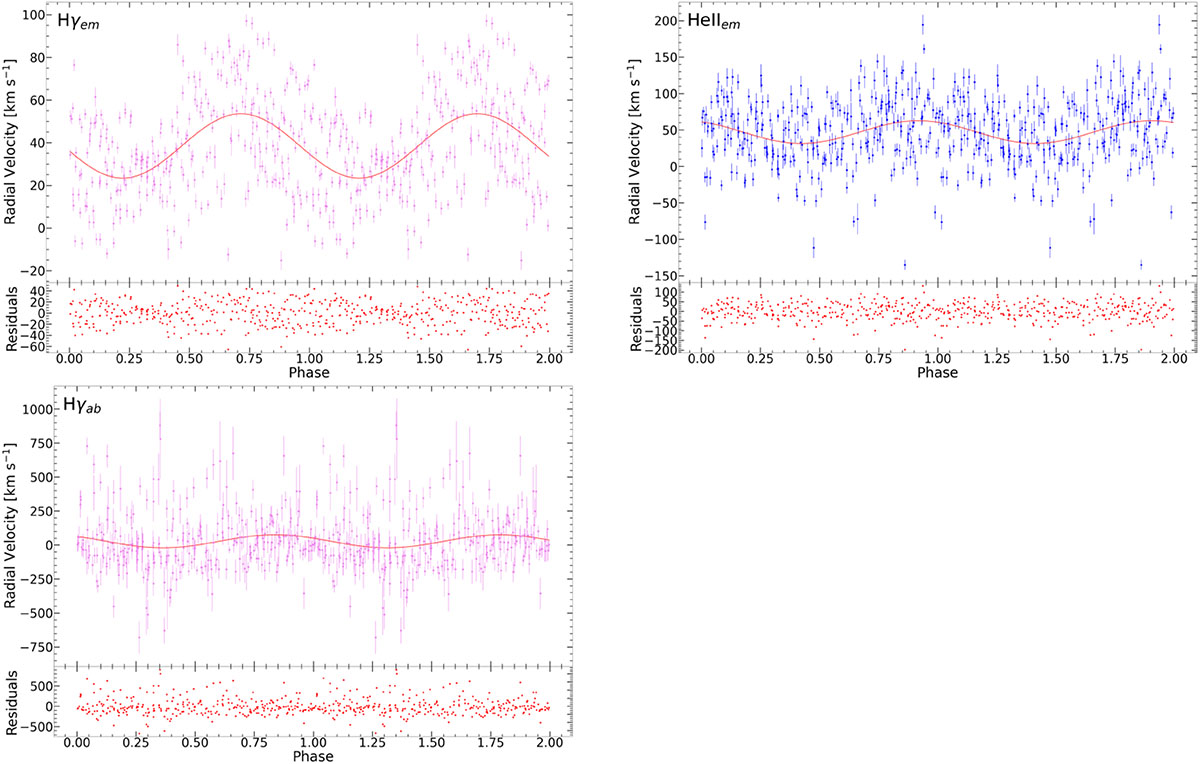
Fig. B.2.
Download original image
Hγ emission (Hγem, top left) and absorption (Hγab, bottom left) line radial velocities phase-folded on the 3.645-hour period, with the phase-folded He IIλ4686 emission line radial velocities at top right. The fitted sine functions, with the parameters in Table 2, are also shown, with the residuals in the lower panels of each plot.
Current usage metrics show cumulative count of Article Views (full-text article views including HTML views, PDF and ePub downloads, according to the available data) and Abstracts Views on Vision4Press platform.
Data correspond to usage on the plateform after 2015. The current usage metrics is available 48-96 hours after online publication and is updated daily on week days.
Initial download of the metrics may take a while.