Open Access
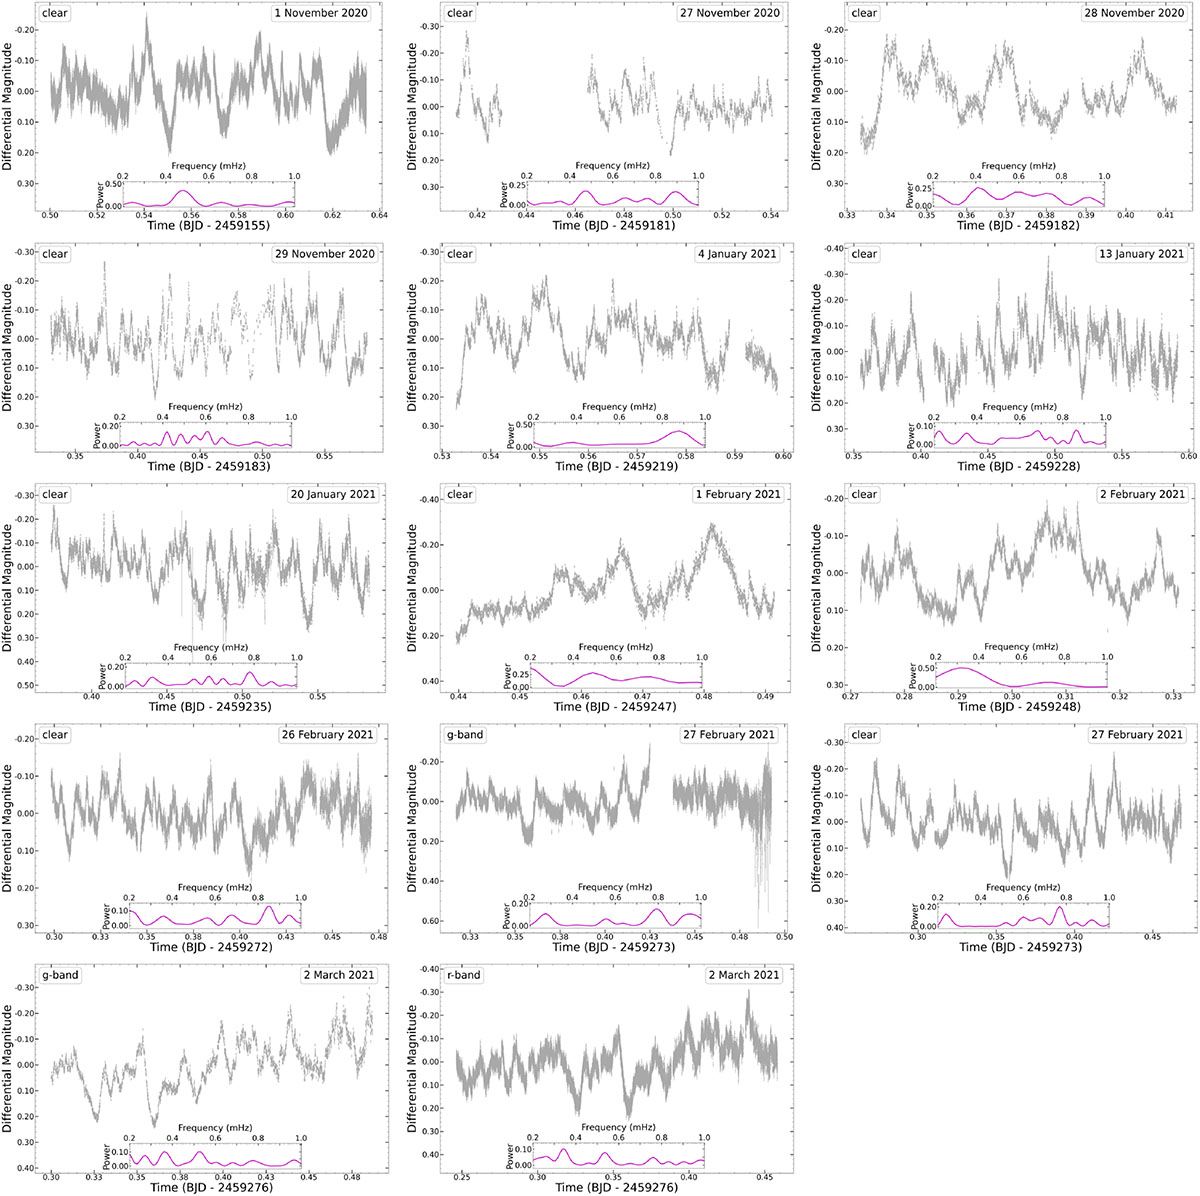
Fig. C.1.
Download original image
Light curve plots form all photometric observations. The filter used for the observations is found in the top left corner of each respective figure. The inset plot shows the power spectrum from Lomb-Scragle period analysis.
Current usage metrics show cumulative count of Article Views (full-text article views including HTML views, PDF and ePub downloads, according to the available data) and Abstracts Views on Vision4Press platform.
Data correspond to usage on the plateform after 2015. The current usage metrics is available 48-96 hours after online publication and is updated daily on week days.
Initial download of the metrics may take a while.