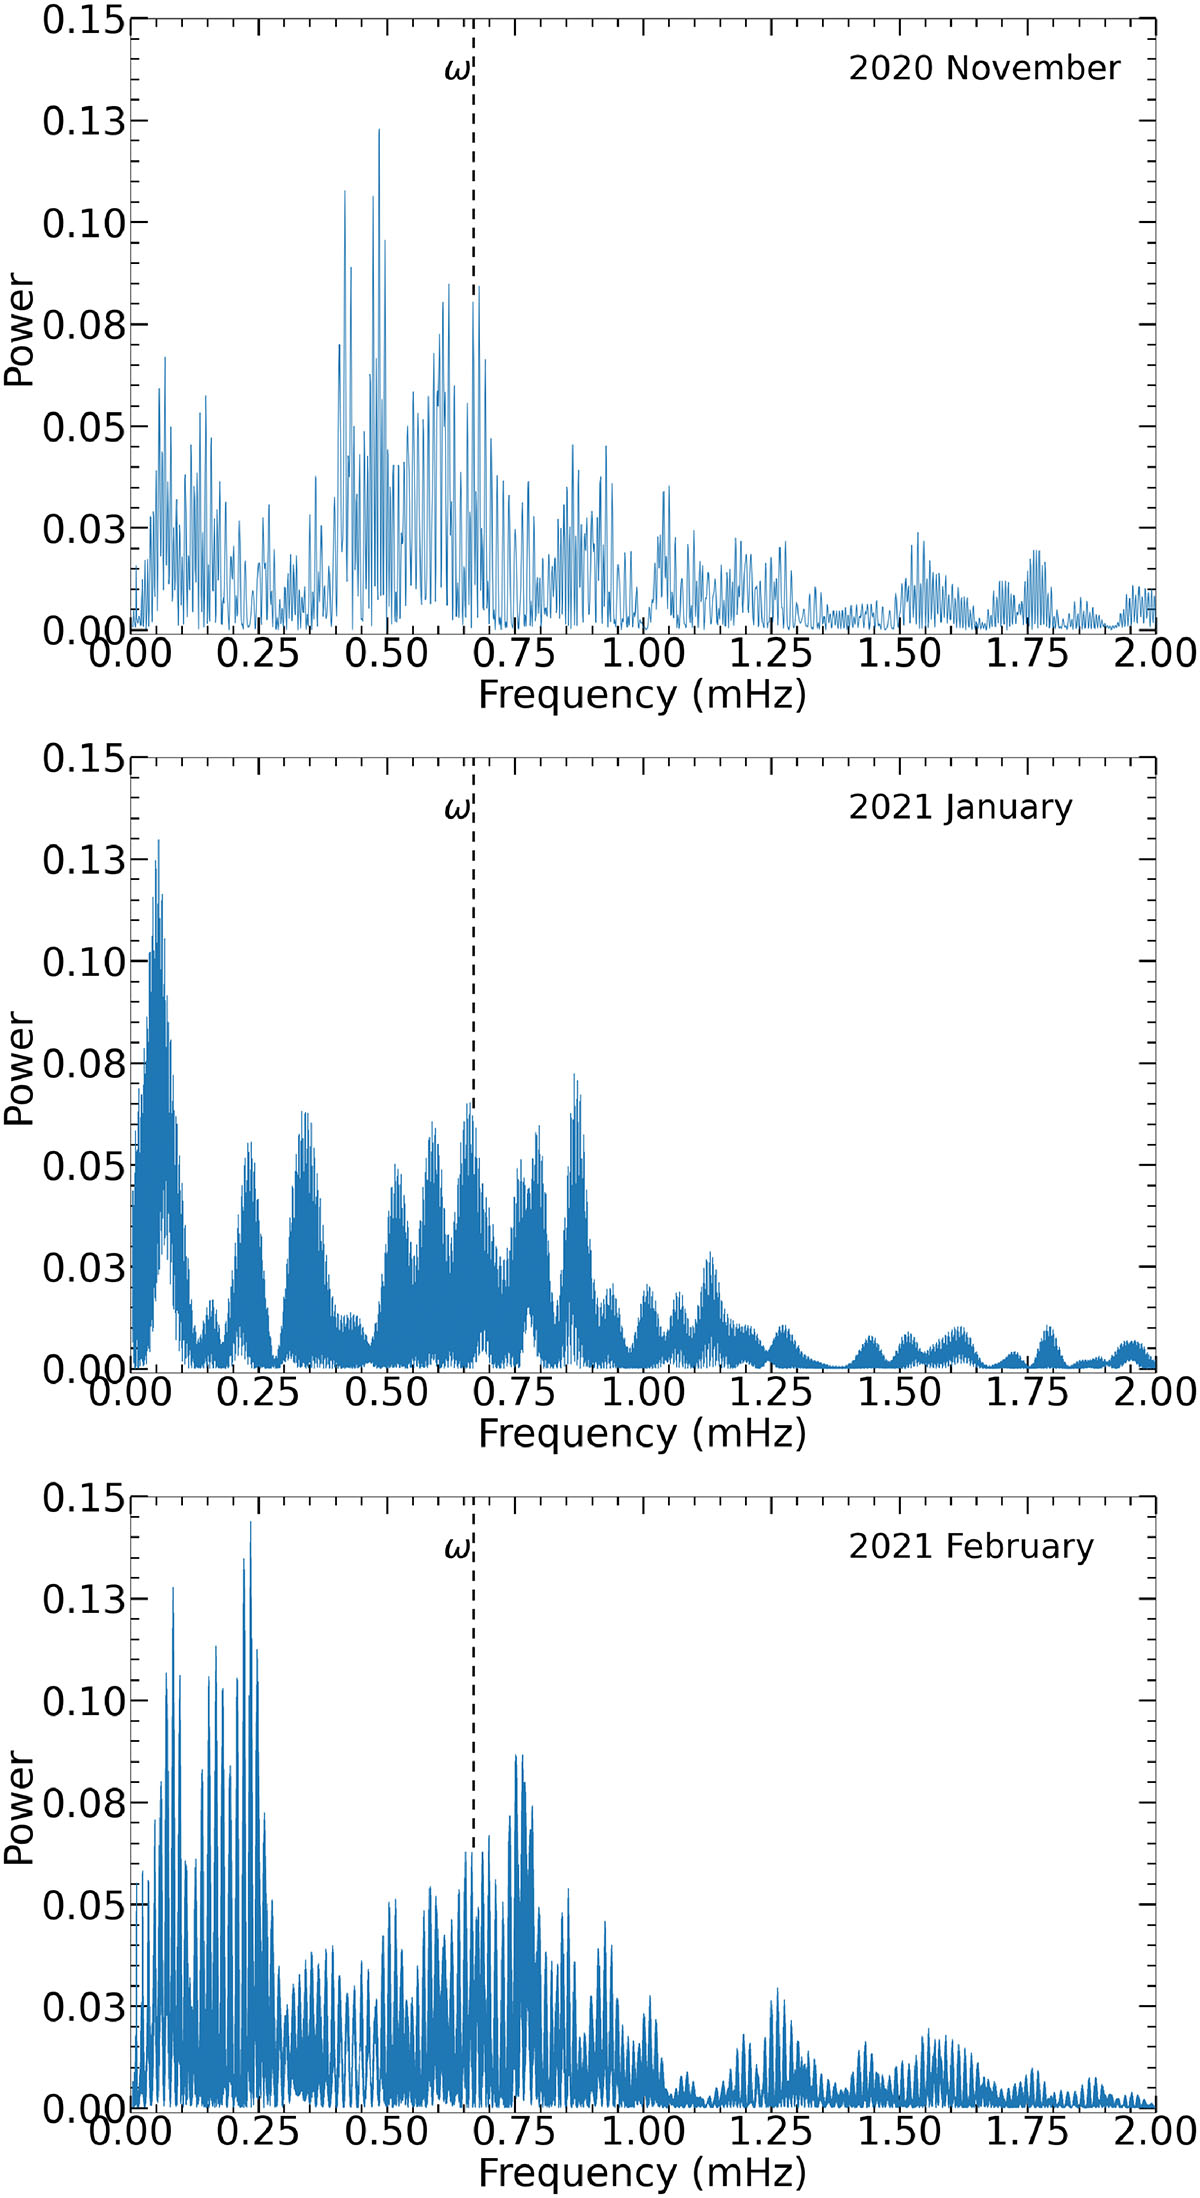
Fig. C.3.
Download original image
Lomb-Scargle power spectra of the clear filter photometric observations. The observations were divided into three groups, the combined observations obtained in 2020 November (top panel), those obtained in 2021 January (middle panel) and those obtained in 2021 February (bottom panel). In each panel, the spin frequency of the WD is indicated by the dashed line labelled ω, and show that some power is seen in each grouping at ω. It is evident from these three groupings that there is significant change in the power spectrum on short (weeks, or shorter) timescales, which could be interpreted as showing evidence of QPOs.
Current usage metrics show cumulative count of Article Views (full-text article views including HTML views, PDF and ePub downloads, according to the available data) and Abstracts Views on Vision4Press platform.
Data correspond to usage on the plateform after 2015. The current usage metrics is available 48-96 hours after online publication and is updated daily on week days.
Initial download of the metrics may take a while.