Open Access
Fig. C.4.
Download original image
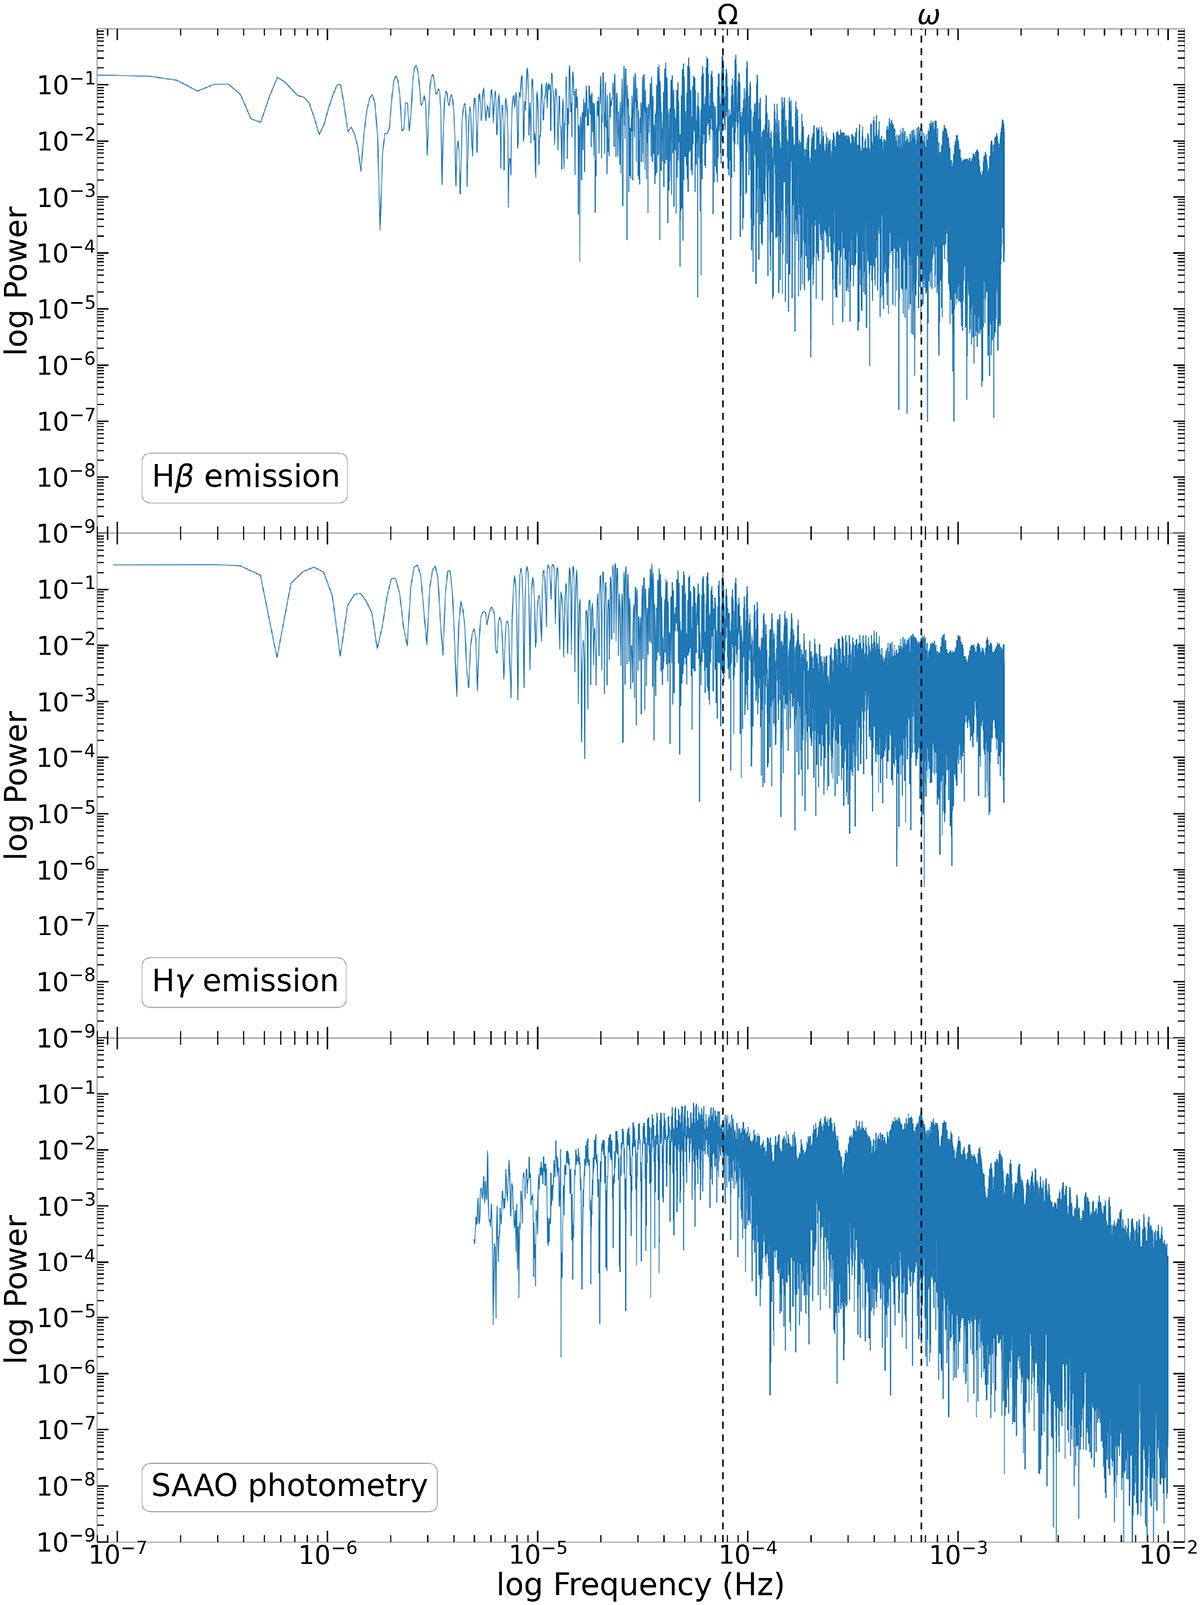
Log-log power spectra of the Hβ emission line radial velocities (top), Haγ emission (middle), and the SAAO photometric observations (bottom). Each panel extends to the respective Nyquist frequency of the observation. The dashed vertical lines indicate the spectroscopic orbital, Ω, and spin, ω, frequencies, respectively.
Current usage metrics show cumulative count of Article Views (full-text article views including HTML views, PDF and ePub downloads, according to the available data) and Abstracts Views on Vision4Press platform.
Data correspond to usage on the plateform after 2015. The current usage metrics is available 48-96 hours after online publication and is updated daily on week days.
Initial download of the metrics may take a while.