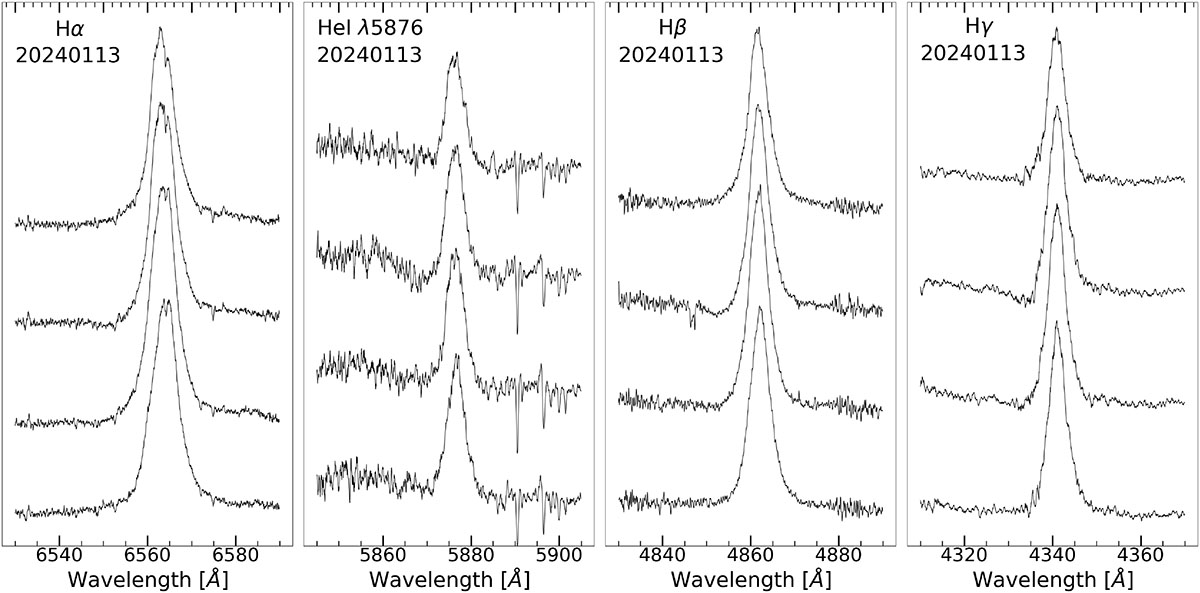
Fig. 8.
Download original image
2024 January 13 continuum subtracted normalized SALT HRS stacked spectra, focusing on the Balmer emission lines as well as He Iλ5876. All the spectra were smoothed by a moving 1D box kernel of size 3, 7, 4, and 11 for Hα, He Iλ5876, Hβ, and Hγ, respectively. Each spectrum is a 600-second exposure, with the first spectrum being the first from the bottom and the last spectrum obtained at the top. The absorption features seen at around 5890 Å and 5896 Å in the He I plot are from telluric lines. Note, the absorption to the blue in the third spectrum of the emission lines. The offset of the stacked spectra were 0.0023, 0.001, 0.0025, and 0.007 for Hα, He Iλ5876, Hβ, and Hγ, respectively.
Current usage metrics show cumulative count of Article Views (full-text article views including HTML views, PDF and ePub downloads, according to the available data) and Abstracts Views on Vision4Press platform.
Data correspond to usage on the plateform after 2015. The current usage metrics is available 48-96 hours after online publication and is updated daily on week days.
Initial download of the metrics may take a while.