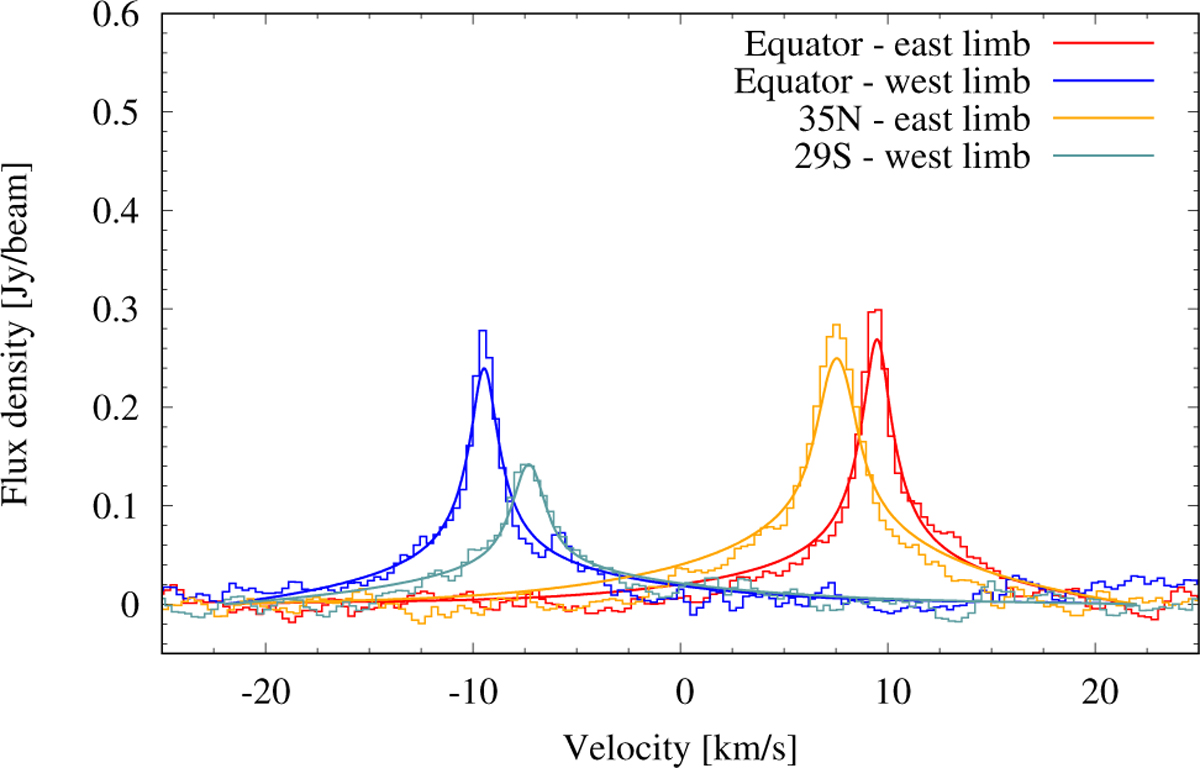
Fig. 11
Download original image
Example of final spectra obtained with ALMA in January 2012 with their respective best fits for various latitudes exploring the two limbs, with a highlight on the location of the beacon. The strongest emission seen in the beacon (for example, orange spectrum and fit) is caused by the temperature increase at mbar pressures inside the hot vortex. The lines are plotted in the velocity frame with respect to the line rest frequency (230.538 GHz).
Current usage metrics show cumulative count of Article Views (full-text article views including HTML views, PDF and ePub downloads, according to the available data) and Abstracts Views on Vision4Press platform.
Data correspond to usage on the plateform after 2015. The current usage metrics is available 48-96 hours after online publication and is updated daily on week days.
Initial download of the metrics may take a while.