Fig. 15
Download original image
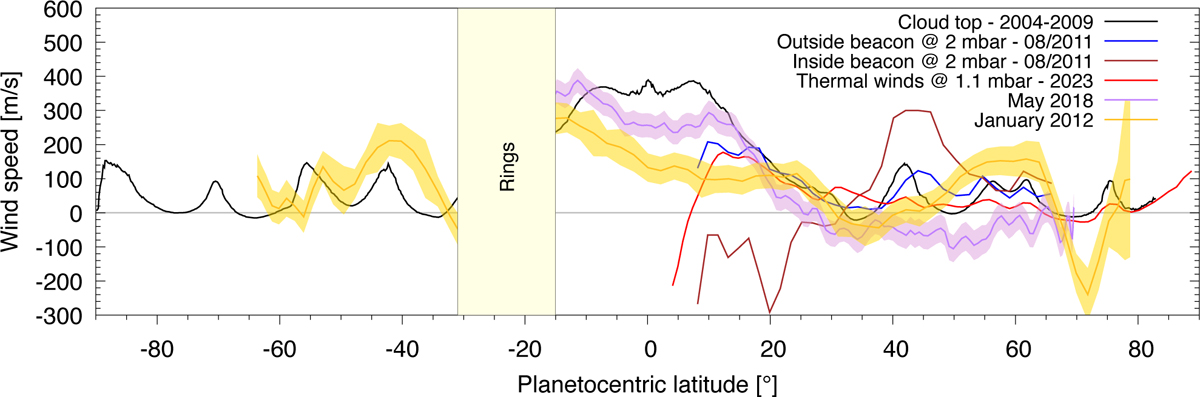
Comparison of average stratospheric wind speeds at 0.2–1 mbar between January 2012 (gold line) and May 2018 (purple line) with their respective 1-σ error bar envelopes. The January 2012 data are the average of the data shown in Fig. 13 after compensating for LOS projection. Error bars are also compensated for LOS projection. May 2018 data are taken from Benmahi et al. (2025). For the purpose of comparison, cloud-top winds measured by García-Melendo et al. (2011) with Cassini between 2004 and 2009 (black line), thermal winds on August 21, 2011 calculated at 2 mbar by Fletcher et al. (2012) outside beacon longitudes (blue line) and at the beacon central longitude (brown line), and thermal winds 1.1 mbar from temperature retrievals applied to JWST observations of 2022 by Fletcher et al. (2023) (red line), are overplotted.
Current usage metrics show cumulative count of Article Views (full-text article views including HTML views, PDF and ePub downloads, according to the available data) and Abstracts Views on Vision4Press platform.
Data correspond to usage on the plateform after 2015. The current usage metrics is available 48-96 hours after online publication and is updated daily on week days.
Initial download of the metrics may take a while.