Fig. 2
Download original image
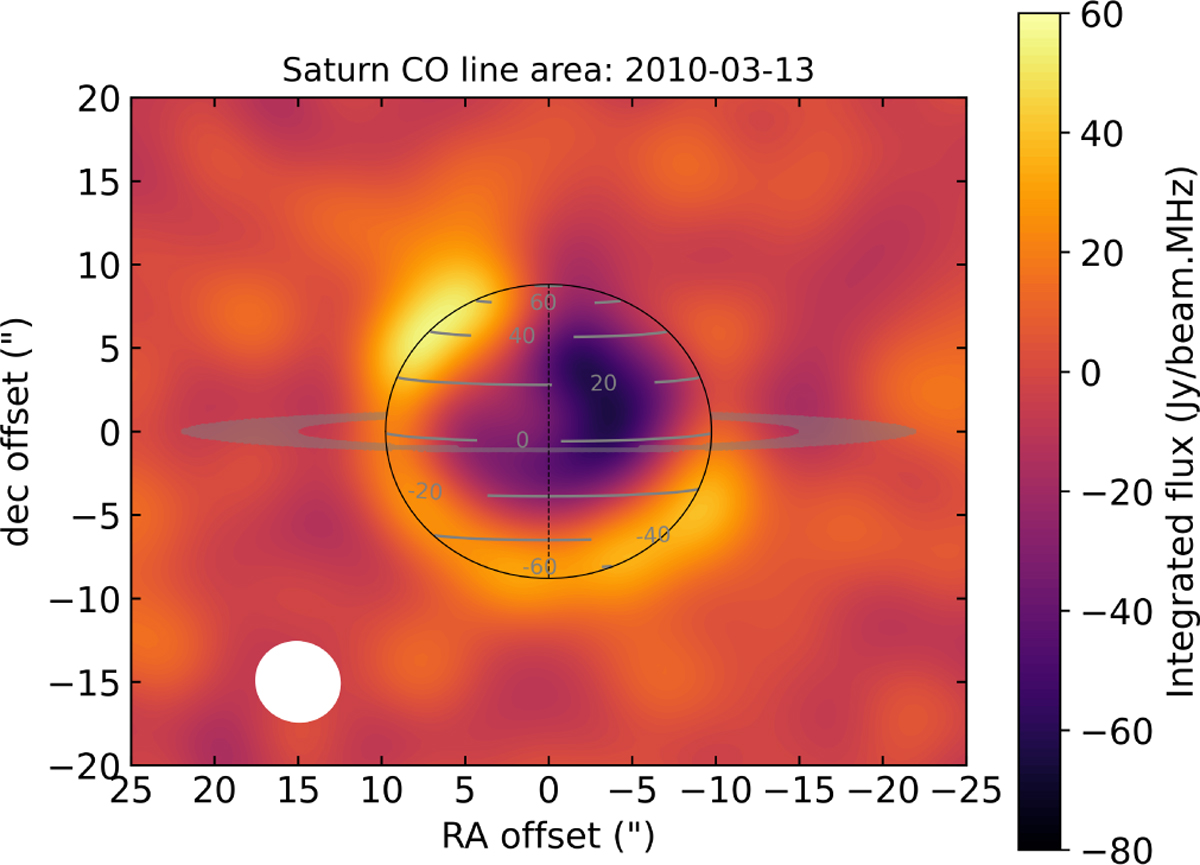
CO (J=3–2) line area map, as observed with SMA on March 13, 2010. The 1-bar level is shown with the black ellipse, the planet rotation axis is displayed with a dashed black line, and isolatitudes are indicated by gray contours. The expected position of the A and B rings is depicted by the gray filled area and the beam is illustrated with a white filled ellipse.
Current usage metrics show cumulative count of Article Views (full-text article views including HTML views, PDF and ePub downloads, according to the available data) and Abstracts Views on Vision4Press platform.
Data correspond to usage on the plateform after 2015. The current usage metrics is available 48-96 hours after online publication and is updated daily on week days.
Initial download of the metrics may take a while.