Fig. 3
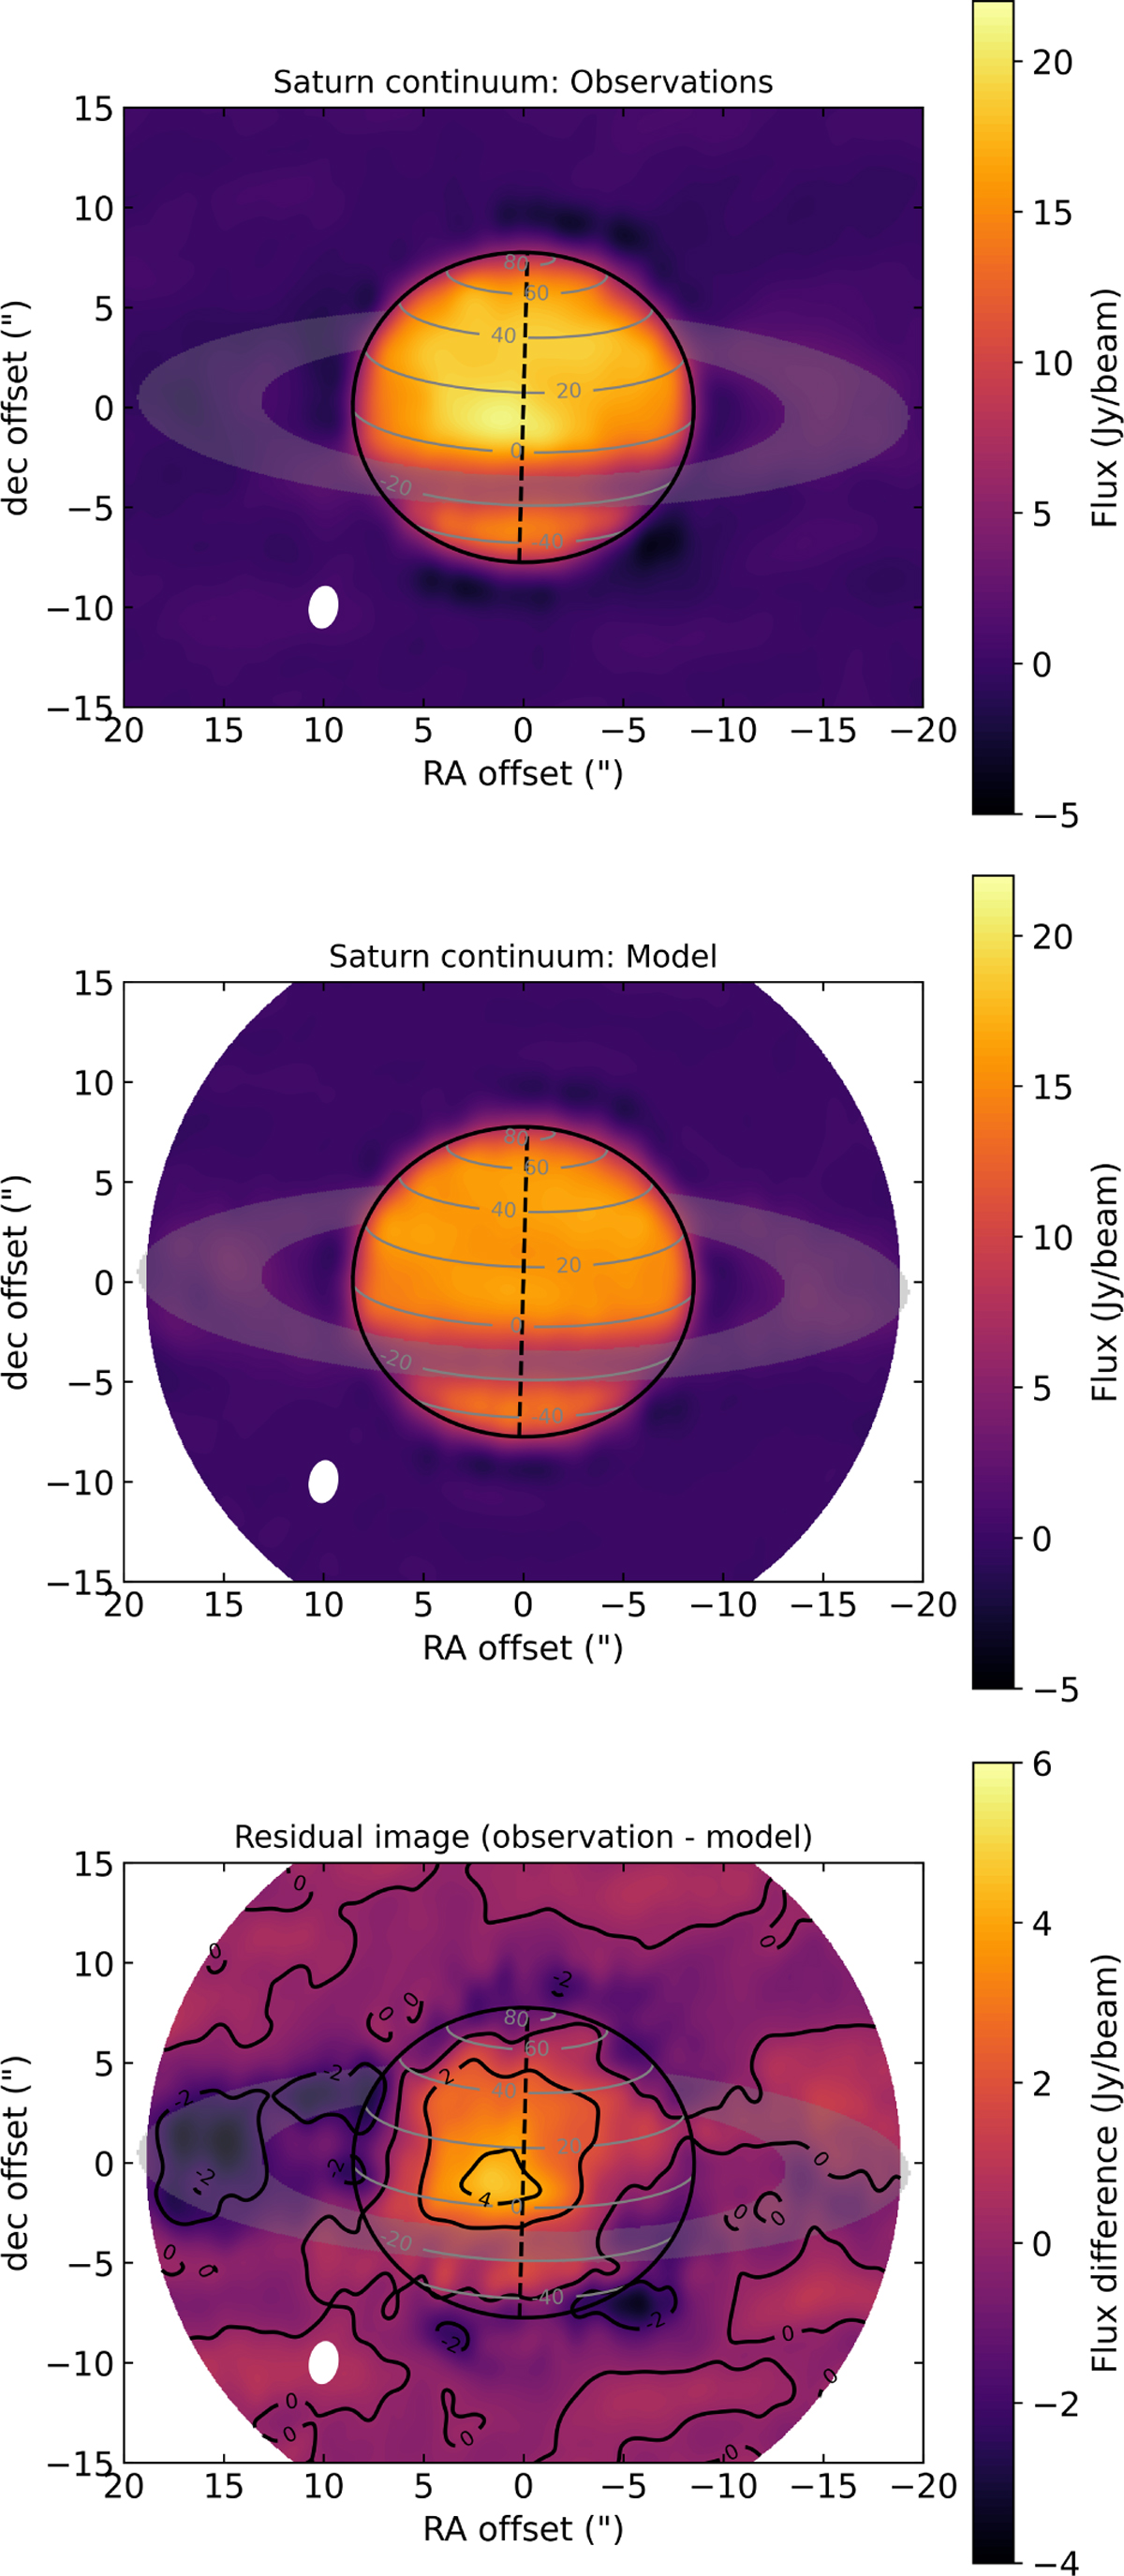
Download original image
Saturn continuum flux density images at 230 GHz. (Top) Saturn continuum image as observed with ALMA on January 14, 2012. (Center) Simulated continuum image in the conditions of the January 2012 observations. (Bottom) Residuals (observation – model) showing the overall good agreement between model and observations, especially at the limb. In all panels, the 1-bar level is shown with the black ellipse, the planet rotation axis is displayed with a dashed black line, and isolatitudes are indicated by gray contours. The expected position of the A and B rings is depicted by the gray filled area and the beam is illustrated with a white filled ellipse.
Current usage metrics show cumulative count of Article Views (full-text article views including HTML views, PDF and ePub downloads, according to the available data) and Abstracts Views on Vision4Press platform.
Data correspond to usage on the plateform after 2015. The current usage metrics is available 48-96 hours after online publication and is updated daily on week days.
Initial download of the metrics may take a while.