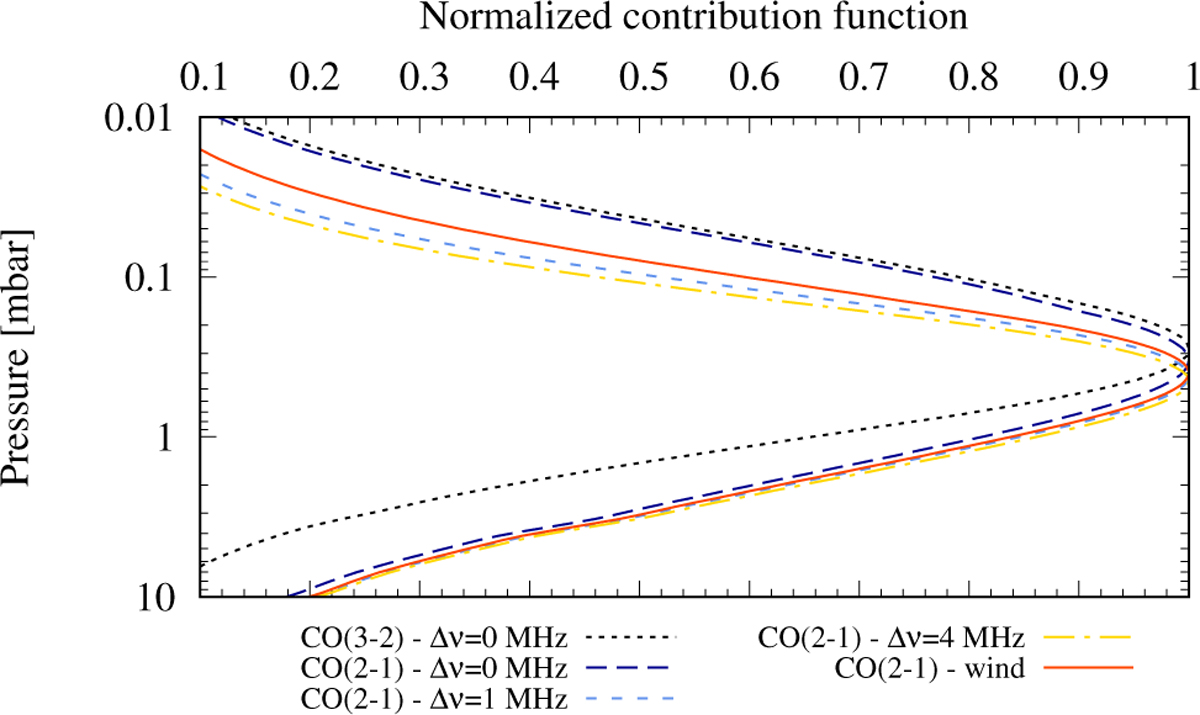
Fig. 7
Download original image
Normalized contribution functions at the line center for the CO (J=3–2) line observed with SMA in March 2010 (dotted black line) and CO (J=2–1) line observed with ALMA in January 2012 (long-dashed, dark blue line). Contribution functions are also presented for the CO (J=2–1) line for 1 MHz (shortdashed, light blue line) and 4 MHz (dashed-dotted, yellow line) frequency offsets with respect to the line center. The wind contribution function pertaining to the CO (J=2–1) observations is plotted with a solid red line. All contribution functions are calculated at the equatorial planet limb with the rescaled 220-year-old-comet-impact profile of Cavalié et al. (2010) and account for the relevant spatial and spectral convolutions.
Current usage metrics show cumulative count of Article Views (full-text article views including HTML views, PDF and ePub downloads, according to the available data) and Abstracts Views on Vision4Press platform.
Data correspond to usage on the plateform after 2015. The current usage metrics is available 48-96 hours after online publication and is updated daily on week days.
Initial download of the metrics may take a while.