Fig. 9
Download original image
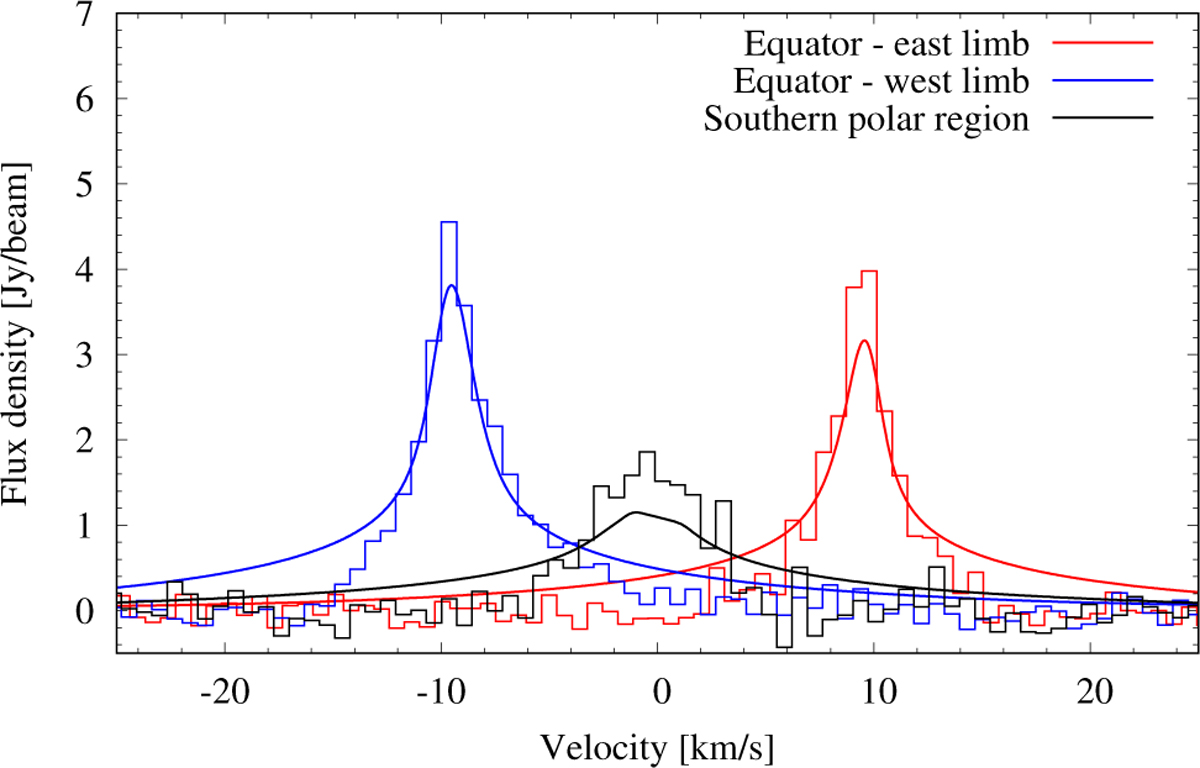
Example of a final spectra obtained with SMA in March 2010 and corresponding best fits obtained for a few latitudes, and exploring the two limbs with the 220-year-old-comet-impact profile of Cavalié et al. (2010) after proper rescaling. The lines are plotted in the velocity frame with respect to the line rest frequency (345.796 GHz). They are redshifted on the eastern limb and blueshifted on the western limb because of the planet rapid rotation.
Current usage metrics show cumulative count of Article Views (full-text article views including HTML views, PDF and ePub downloads, according to the available data) and Abstracts Views on Vision4Press platform.
Data correspond to usage on the plateform after 2015. The current usage metrics is available 48-96 hours after online publication and is updated daily on week days.
Initial download of the metrics may take a while.