Fig. 1
Download original image
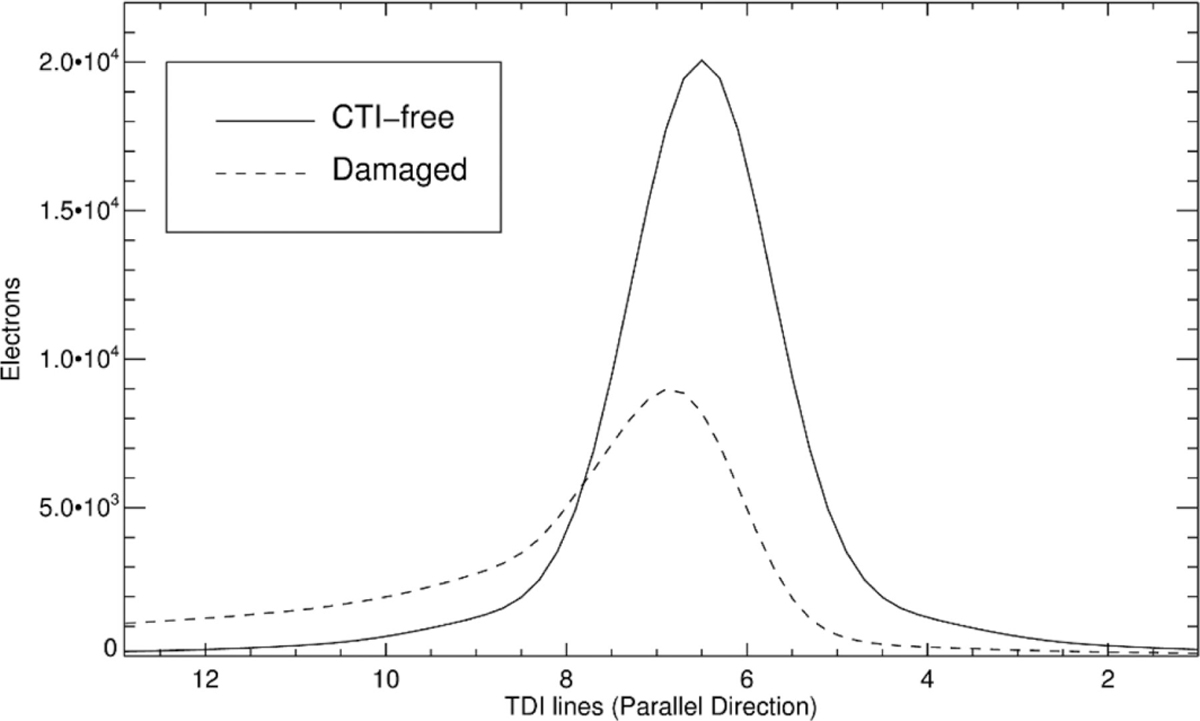
Effect of CTI on the recorded signal in the parallel transfer direction (readout proceeds from left to right). The solid curve shows a CTI-free signal profile, while the dashed curve illustrates the same profile after CTI degradation. Deferred charge release reduces the peak amplitude and produces a trailing towards increasing time delay integration (TDI) lines (earlier pixels in the transfer path). Credit: Short et al. (2013).
Current usage metrics show cumulative count of Article Views (full-text article views including HTML views, PDF and ePub downloads, according to the available data) and Abstracts Views on Vision4Press platform.
Data correspond to usage on the plateform after 2015. The current usage metrics is available 48-96 hours after online publication and is updated daily on week days.
Initial download of the metrics may take a while.