Fig. 11
Download original image
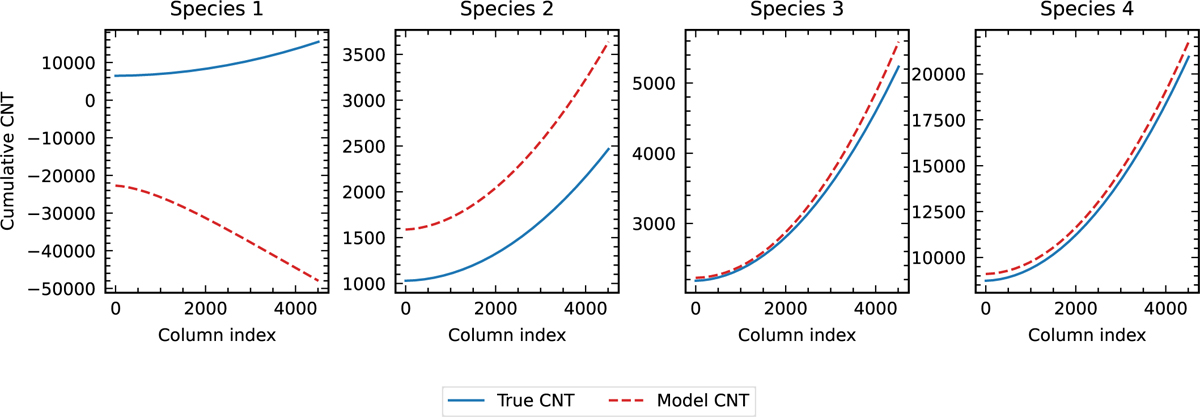
Comparison of cumulative trap density (cnt) at the top of the CCD for all species from two sources: the simulation ground truth (in blue) and the fitted polynomial model (in dashed red). The plot highlights certain species-specific behaviour, with Species 2 exhibiting a systematic offset. Note that Species 1 is poorly constrained because its release time is significantly shorter than the line transfer time; however, as detailed in Sect. 2.5, this species contributes negligibly to the total CTI-induced bias.
Current usage metrics show cumulative count of Article Views (full-text article views including HTML views, PDF and ePub downloads, according to the available data) and Abstracts Views on Vision4Press platform.
Data correspond to usage on the plateform after 2015. The current usage metrics is available 48-96 hours after online publication and is updated daily on week days.
Initial download of the metrics may take a while.