Fig. 12
Download original image
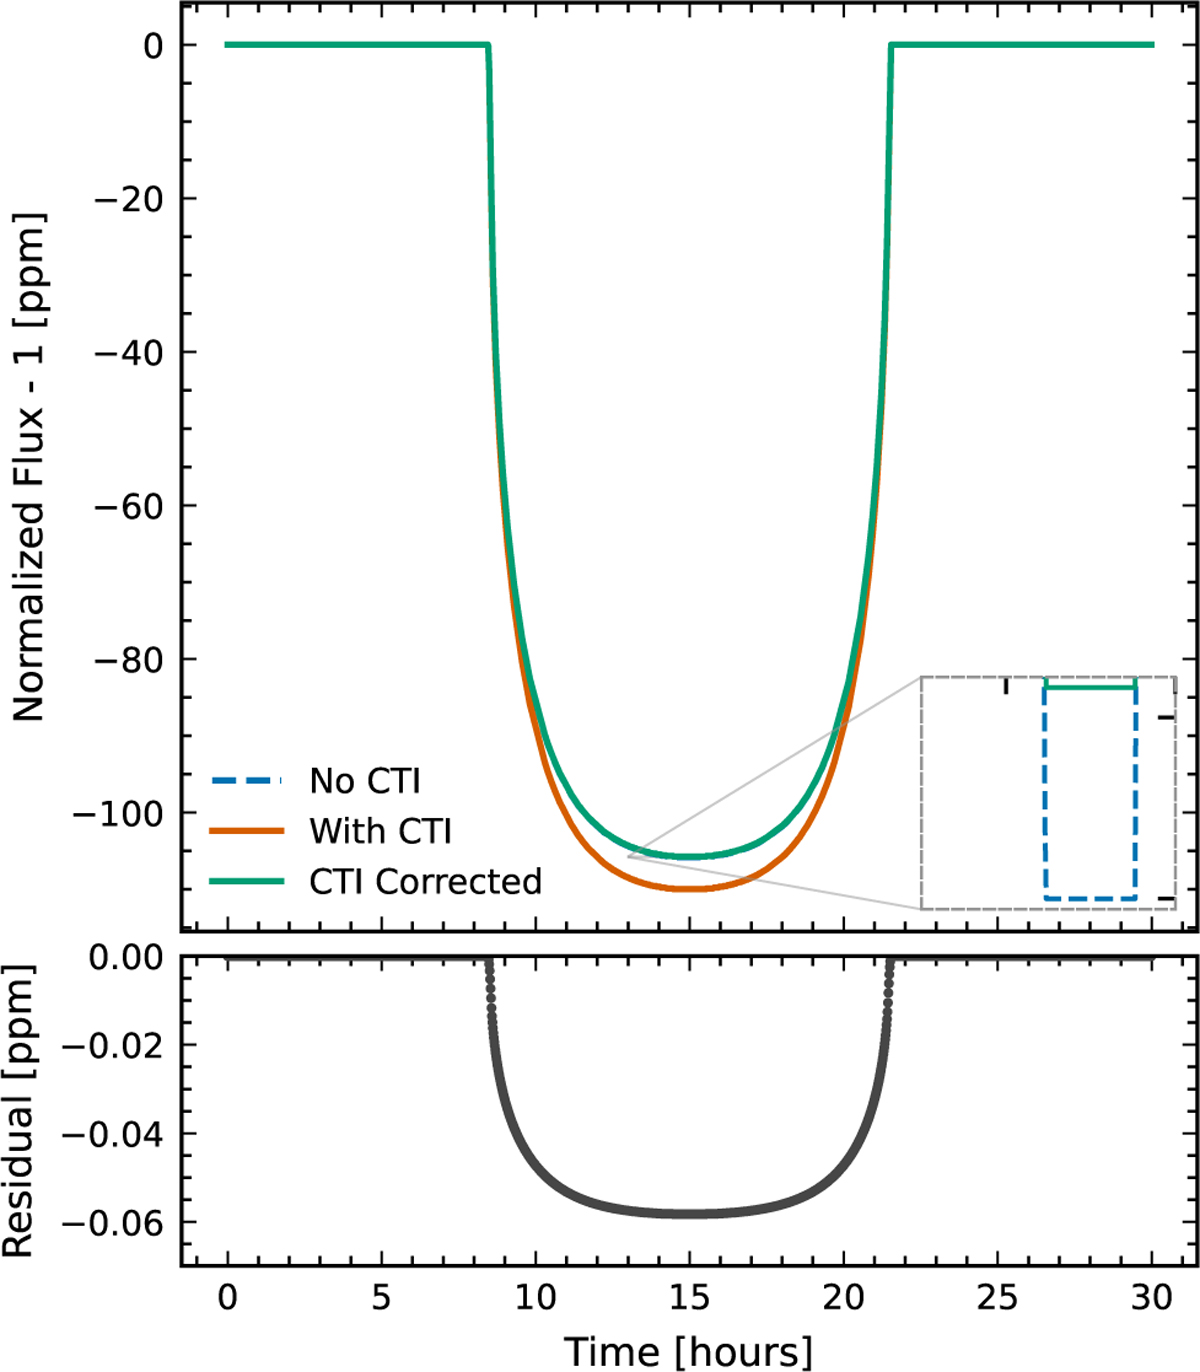
Top: comparison of transit light curves for the worst-case scenario: an 8-year mission, high trap density (position C), and mV = 11. The solid orange curve corresponds to the CTI-affected case, the solid green curve to the CTI-corrected case (nearly overlapping the dashed blue curve representing the CTI-free case). For an initial bias of 3.95%, the correction reduces the residual to 0.06%, achieving an improvement of 98.61%. Bottom: correction residual.
Current usage metrics show cumulative count of Article Views (full-text article views including HTML views, PDF and ePub downloads, according to the available data) and Abstracts Views on Vision4Press platform.
Data correspond to usage on the plateform after 2015. The current usage metrics is available 48-96 hours after online publication and is updated daily on week days.
Initial download of the metrics may take a while.