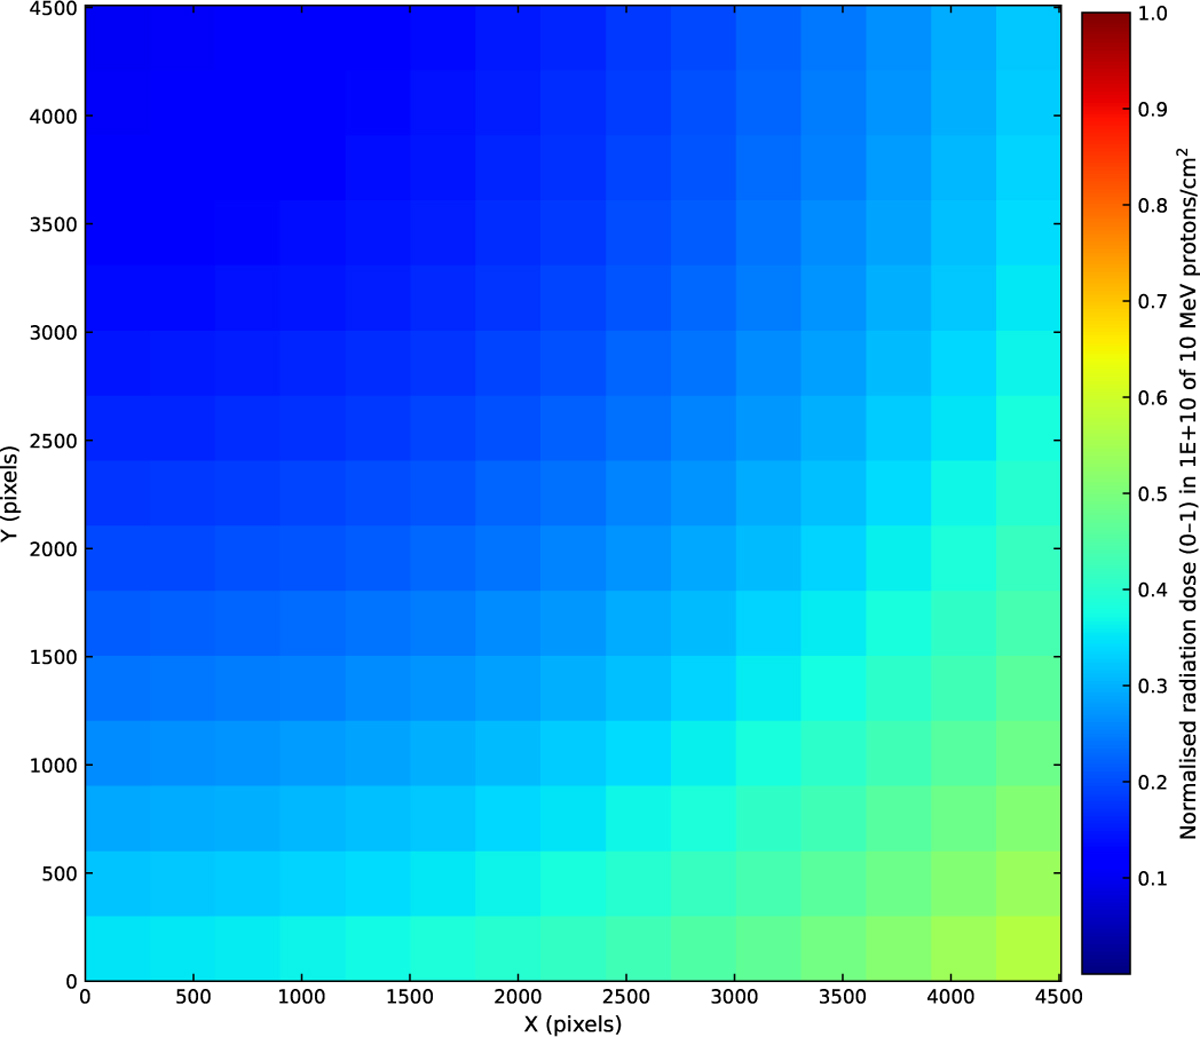
Fig. 3
Download original image
Radiation map generated using the radial dependence model (Eq. (3)) for a 6.5-year TNID exposure. The CCD is oriented with the readout register at the bottom (y = 0). The simulated distribution shows strong agreement with the reference radiation map for CCD #1 (Fig. 2), adapted from OHB System AG (2024), under identical TNID conditions.
Current usage metrics show cumulative count of Article Views (full-text article views including HTML views, PDF and ePub downloads, according to the available data) and Abstracts Views on Vision4Press platform.
Data correspond to usage on the plateform after 2015. The current usage metrics is available 48-96 hours after online publication and is updated daily on week days.
Initial download of the metrics may take a while.