Open Access
Fig. 5
Download original image
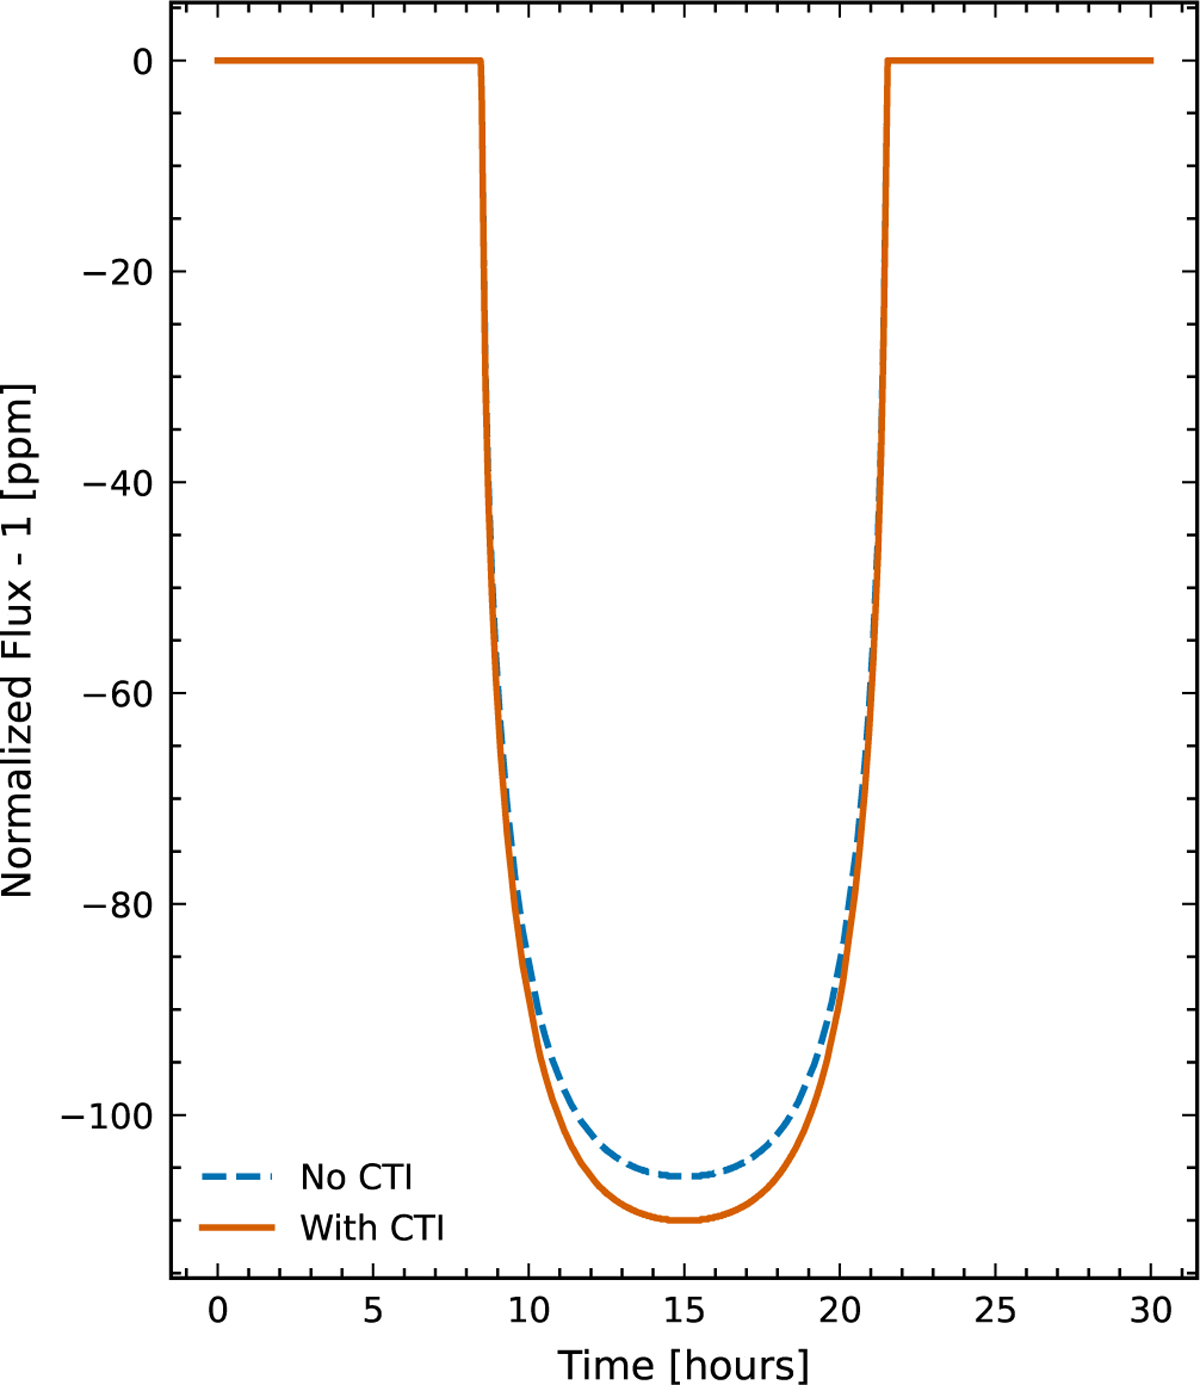
Comparison of transit light curves for the worst-case scenario: an 8-year mission at high trap density (position C) and mV = 11. The solid orange curve includes CTI effects, while the dashed blue curve shows the CTI-free case. CTI-induced charge loss introduces a photometric bias of 3.95%.
Current usage metrics show cumulative count of Article Views (full-text article views including HTML views, PDF and ePub downloads, according to the available data) and Abstracts Views on Vision4Press platform.
Data correspond to usage on the plateform after 2015. The current usage metrics is available 48-96 hours after online publication and is updated daily on week days.
Initial download of the metrics may take a while.