Open Access
Fig. 8
Download original image
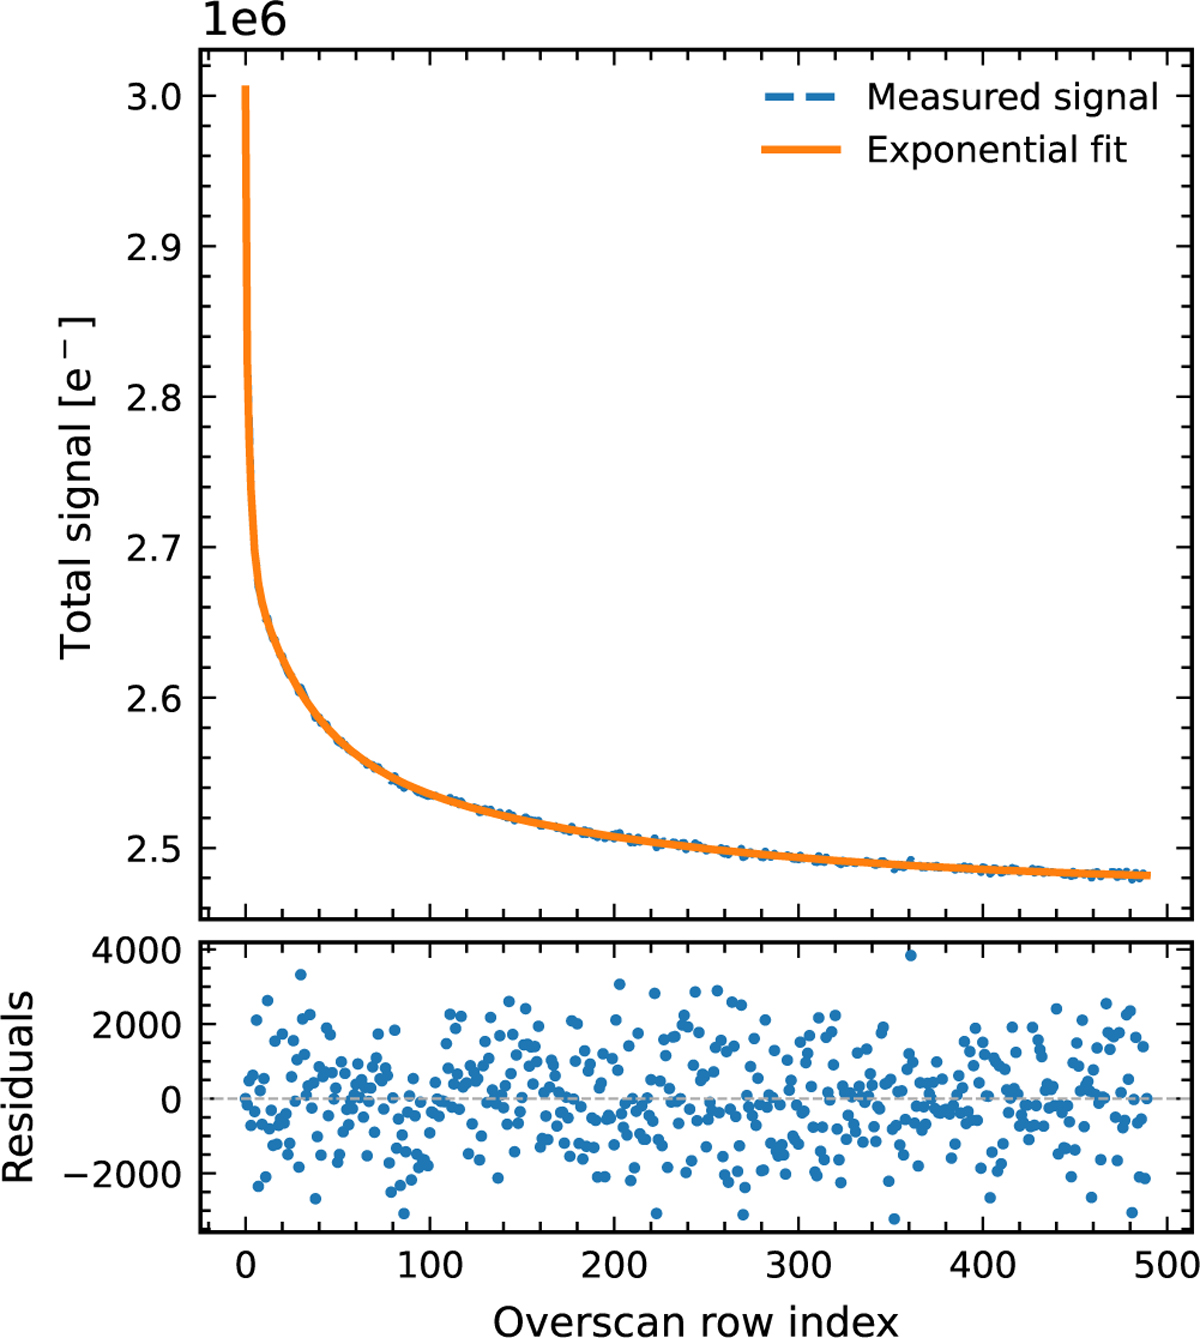
First estimates of the release time constants obtained by fitting the overscan signal. Top: measured signal plotted against the exponential model (Eq. (9)) as a function of row index. Bottom: residuals, indicating good agreement between the data and the model.
Current usage metrics show cumulative count of Article Views (full-text article views including HTML views, PDF and ePub downloads, according to the available data) and Abstracts Views on Vision4Press platform.
Data correspond to usage on the plateform after 2015. The current usage metrics is available 48-96 hours after online publication and is updated daily on week days.
Initial download of the metrics may take a while.