Fig. 1.
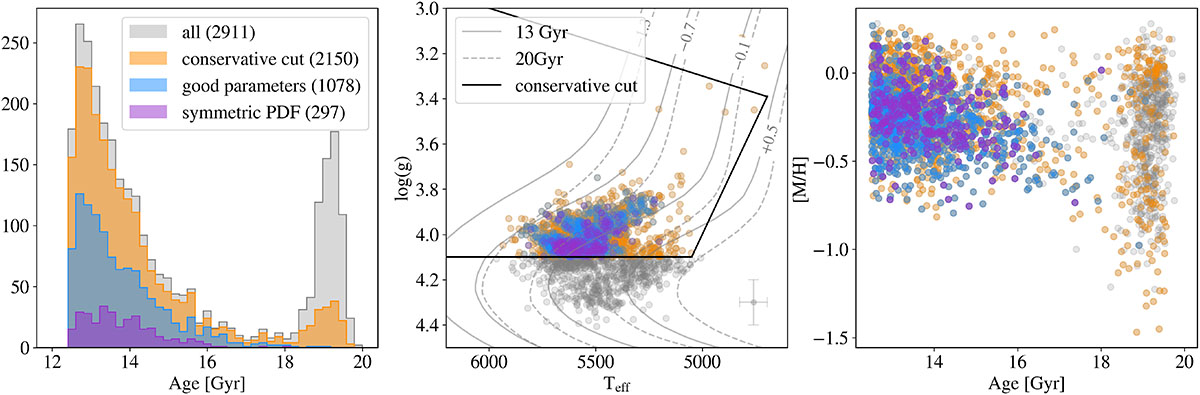
Download original image
Age distribution (left), Kiel diagram (centre), and age-metallicity coverage (right) for each step of the selection process, before visual inspection. In the centre panel, PARSEC isochrones at different ages and metallicities are shown in grey; at the bottom left, the average error in log g and Teff for the full sample is shown. The peak at 19 Gyr visible in the histogram is due to contaminants (see Sect. 3.1 and Appendix A.1).
Current usage metrics show cumulative count of Article Views (full-text article views including HTML views, PDF and ePub downloads, according to the available data) and Abstracts Views on Vision4Press platform.
Data correspond to usage on the plateform after 2015. The current usage metrics is available 48-96 hours after online publication and is updated daily on week days.
Initial download of the metrics may take a while.