Fig. 11.
Download original image
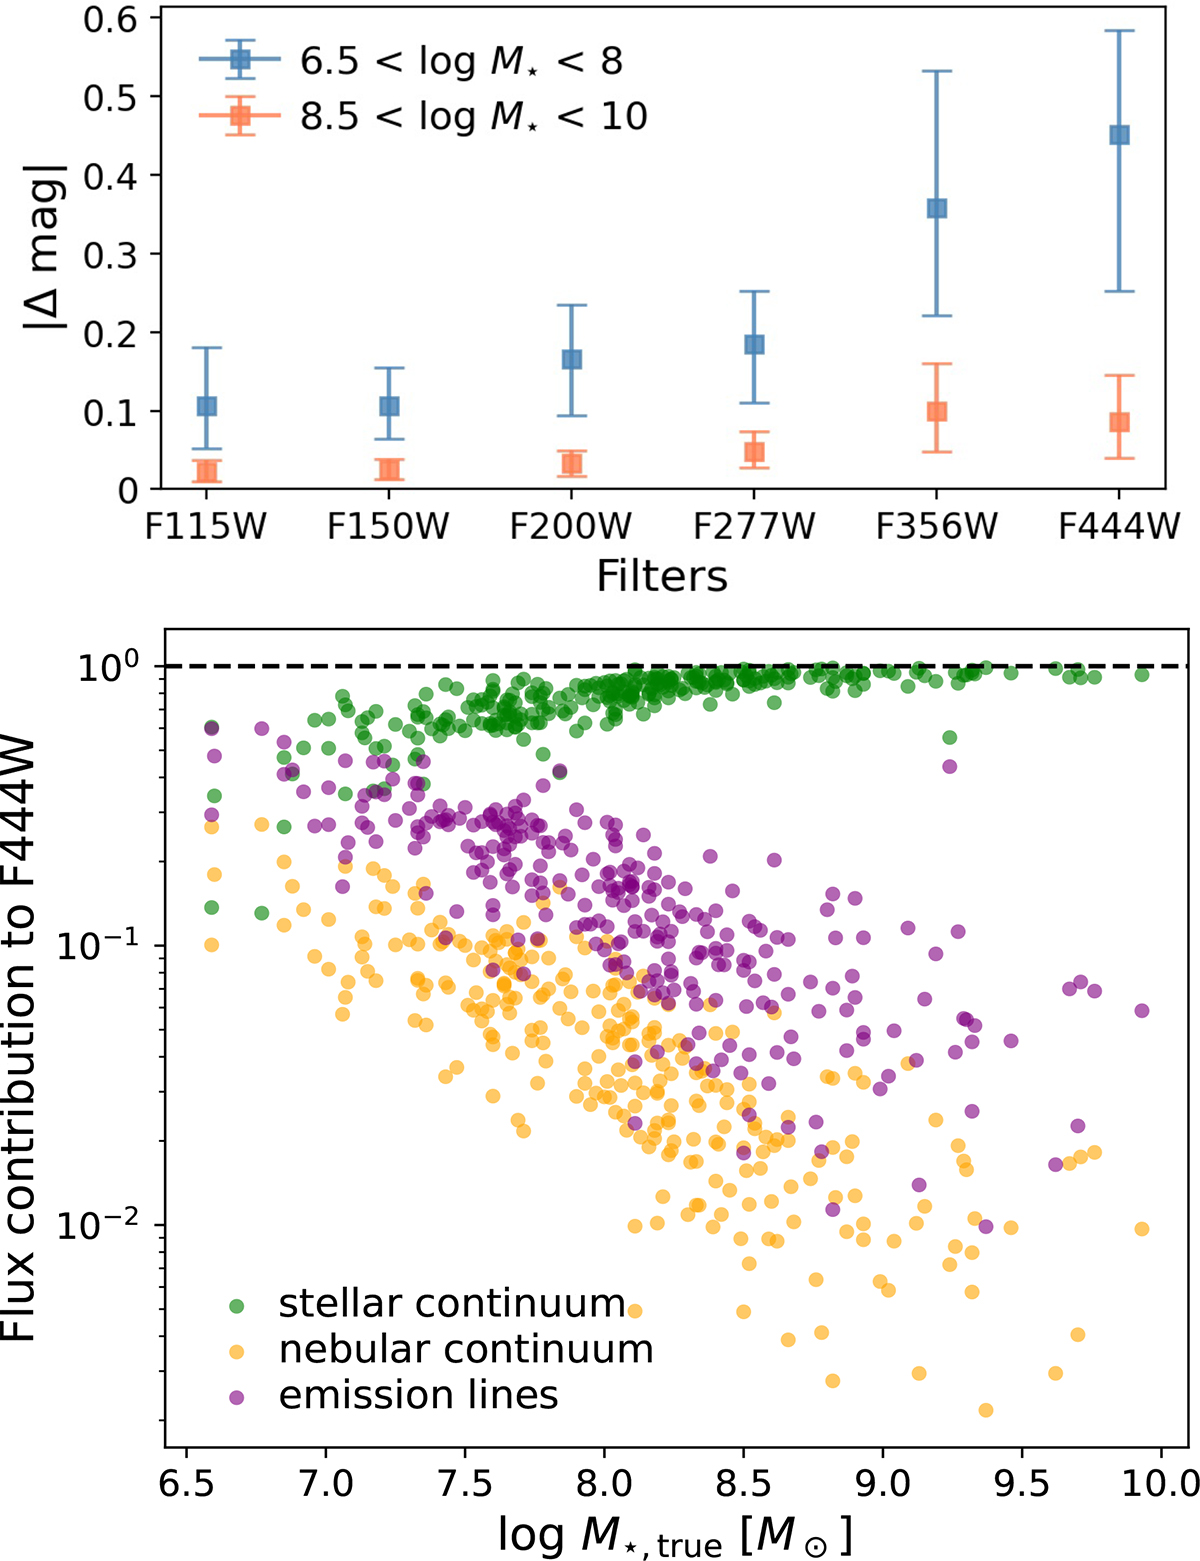
Change in filter magnitudes when nebular emission is added to the stellar continuum for low- and high-mass galaxies, shown in the upper panel. Each point marks the median, with error bars indicating the 16th–84th percentile range. Both galaxy populations appear redder, mainly due to strong optical emission lines in the rest frame optical range, with the effect being more pronounced in low-mass systems. The lower panel presents the flux contributions of the stellar continuum, nebular continuum, and nebular emission lines to the F444W magnitude for each galaxy. In galaxies with log M★/M⊙ ≲ 7.3, the emission-line contribution is comparable to that of the stellar continuum.
Current usage metrics show cumulative count of Article Views (full-text article views including HTML views, PDF and ePub downloads, according to the available data) and Abstracts Views on Vision4Press platform.
Data correspond to usage on the plateform after 2015. The current usage metrics is available 48-96 hours after online publication and is updated daily on week days.
Initial download of the metrics may take a while.