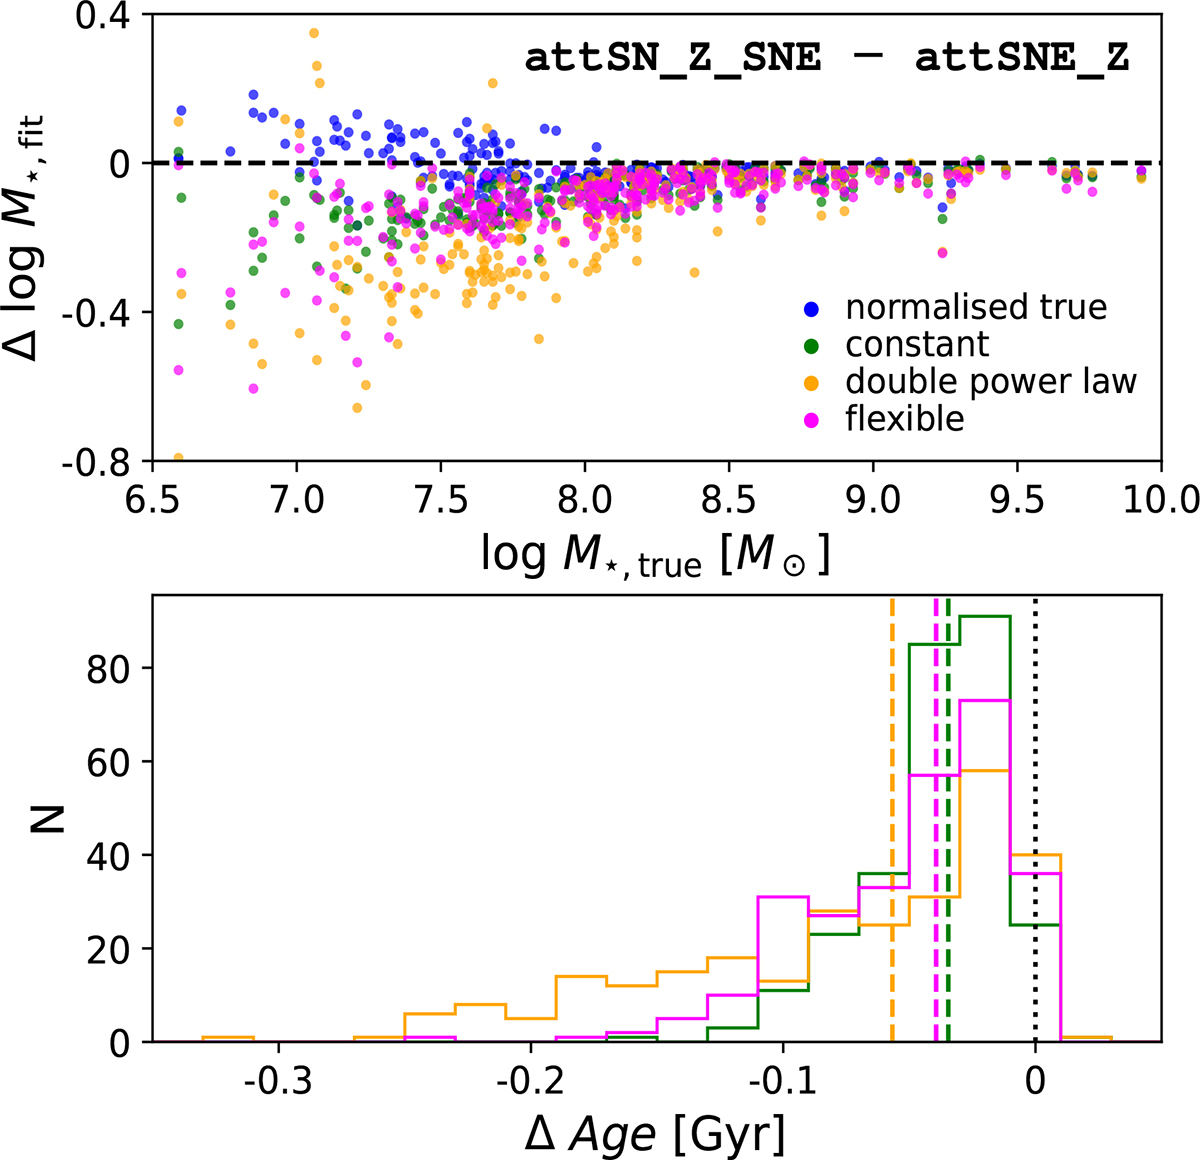
Fig. 13.
Download original image
Impact of emission lines in the input spectrum on inferred galaxy properties. The upper panel presents the difference in the fitted M★ between attSN_Z_SNE (which excludes emission lines from the input spectra, but includes them in the fitting) and attSNE_Z. Emission lines have the strongest effect in low-mass galaxies. The reduction in fitted M★ arises because attSN_Z_SNE infers younger stellar populations, producing a bluer continuum to match the observed colour in the absence of emission lines. The lower panel illustrates this change in stellar populations by illustrating the distribution of differences in mass-weighted age between attSN_Z_SNE and attSNE_Z with the median marked by a dashed line.
Current usage metrics show cumulative count of Article Views (full-text article views including HTML views, PDF and ePub downloads, according to the available data) and Abstracts Views on Vision4Press platform.
Data correspond to usage on the plateform after 2015. The current usage metrics is available 48-96 hours after online publication and is updated daily on week days.
Initial download of the metrics may take a while.