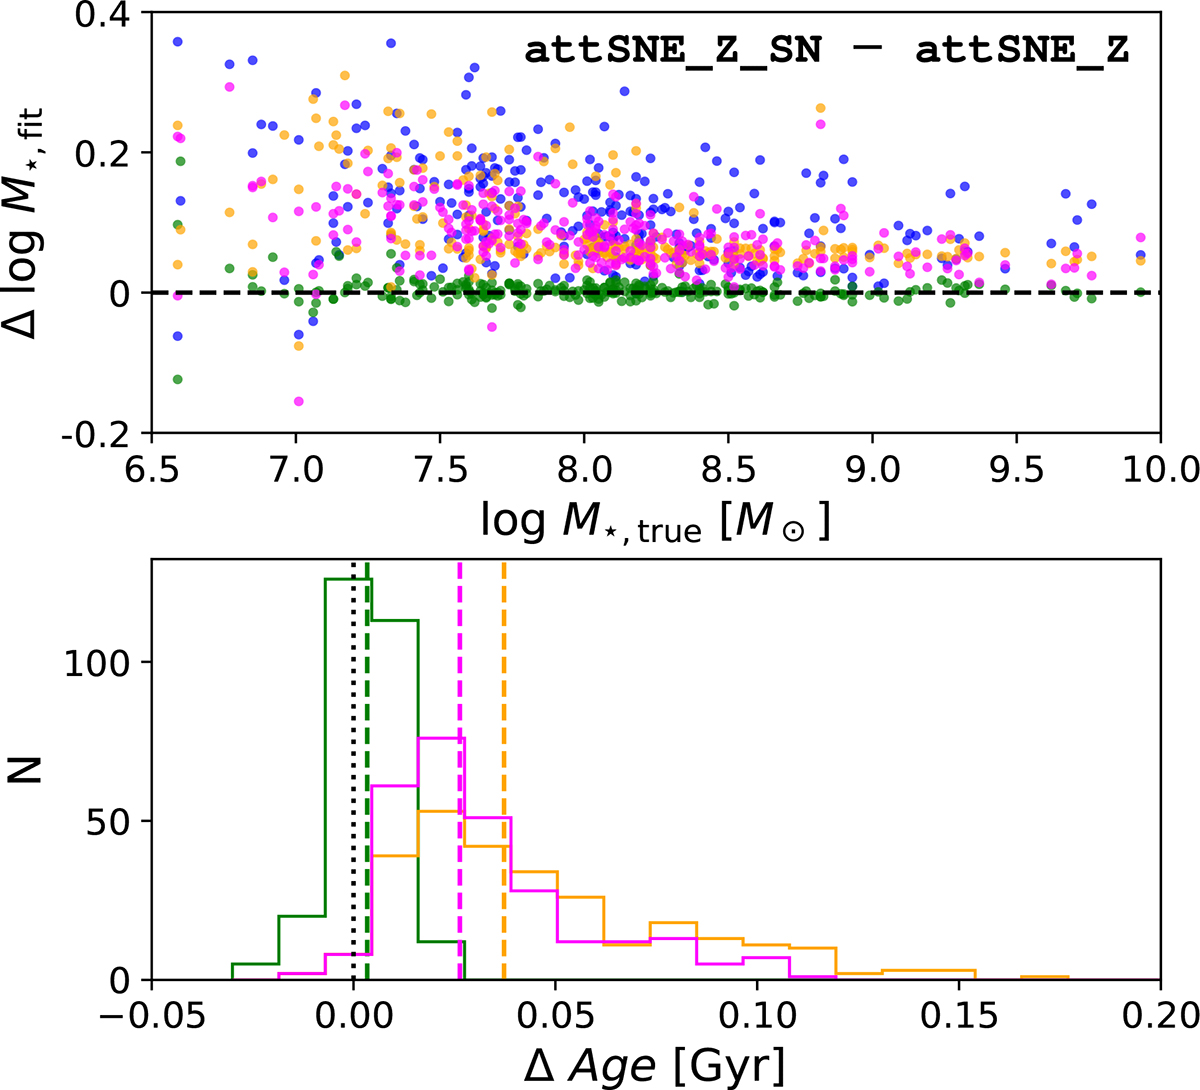
Fig. 14.
Download original image
Same as Fig. 13 but for the attSNE_Z_SN model, which includes emission lines in the input spectra but neglects them in the fitting process. Here, the increase in the fitted M★ mainly reflects changes in the inferred stellar populations, except for the normalised true SFH model, which increases AV to redden the model spectrum instead.
Current usage metrics show cumulative count of Article Views (full-text article views including HTML views, PDF and ePub downloads, according to the available data) and Abstracts Views on Vision4Press platform.
Data correspond to usage on the plateform after 2015. The current usage metrics is available 48-96 hours after online publication and is updated daily on week days.
Initial download of the metrics may take a while.