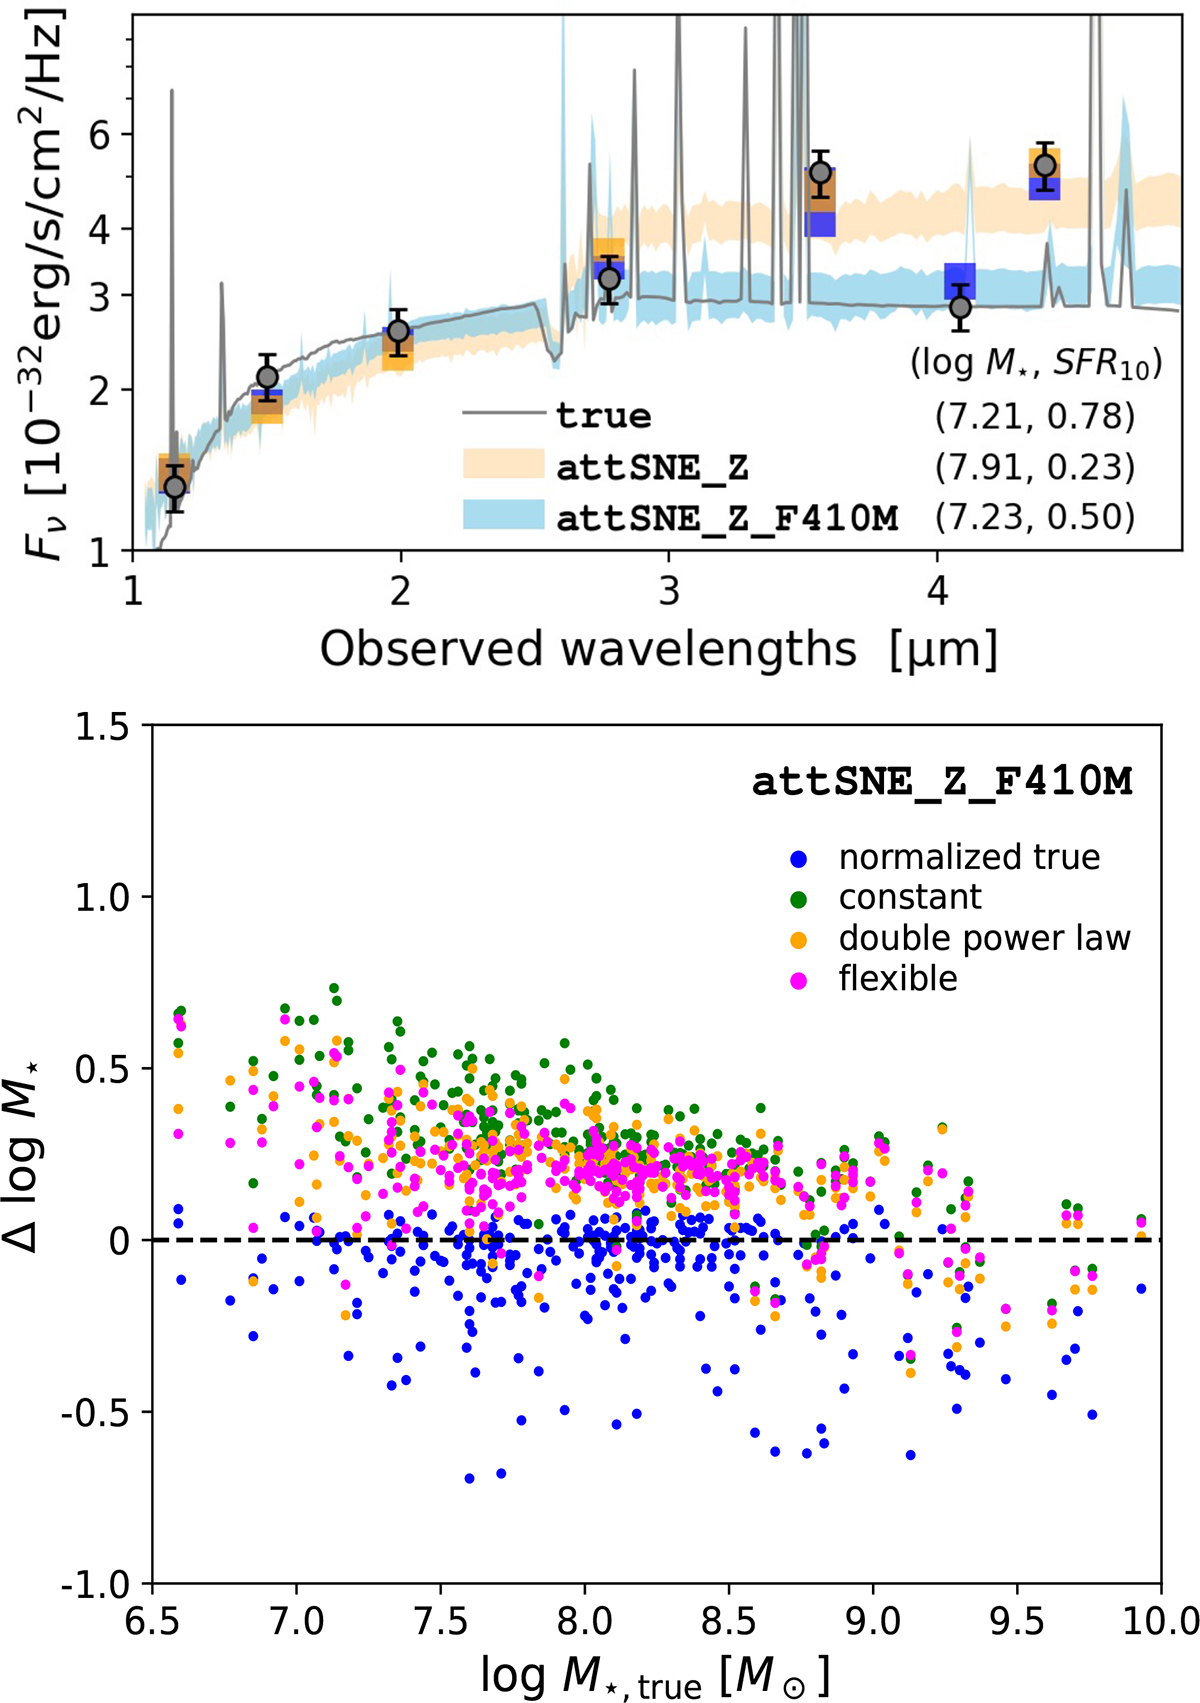
Fig. 16.
Download original image
Upper panel: 16th–84th percentile distribution of the fitted SEDs is presented for an example galaxy using the attSNE_Z (orange) and attSNE_Z_F410M (sky blue) models with the double power-law SFH. Comparing each shaded region with the true SED (gray) indicates that including F410M photometry provides tighter constraints on the SED fitting and consequently on M★ and SFR10. Lower panel: Difference between the true and fitted M★ is shown when the SMC law is applied with attSNE_Z_F410M. The inclusion of F410M photometry substantially reduces the overestimation of M★, particularly in low-mass galaxies.
Current usage metrics show cumulative count of Article Views (full-text article views including HTML views, PDF and ePub downloads, according to the available data) and Abstracts Views on Vision4Press platform.
Data correspond to usage on the plateform after 2015. The current usage metrics is available 48-96 hours after online publication and is updated daily on week days.
Initial download of the metrics may take a while.