Fig. 17.
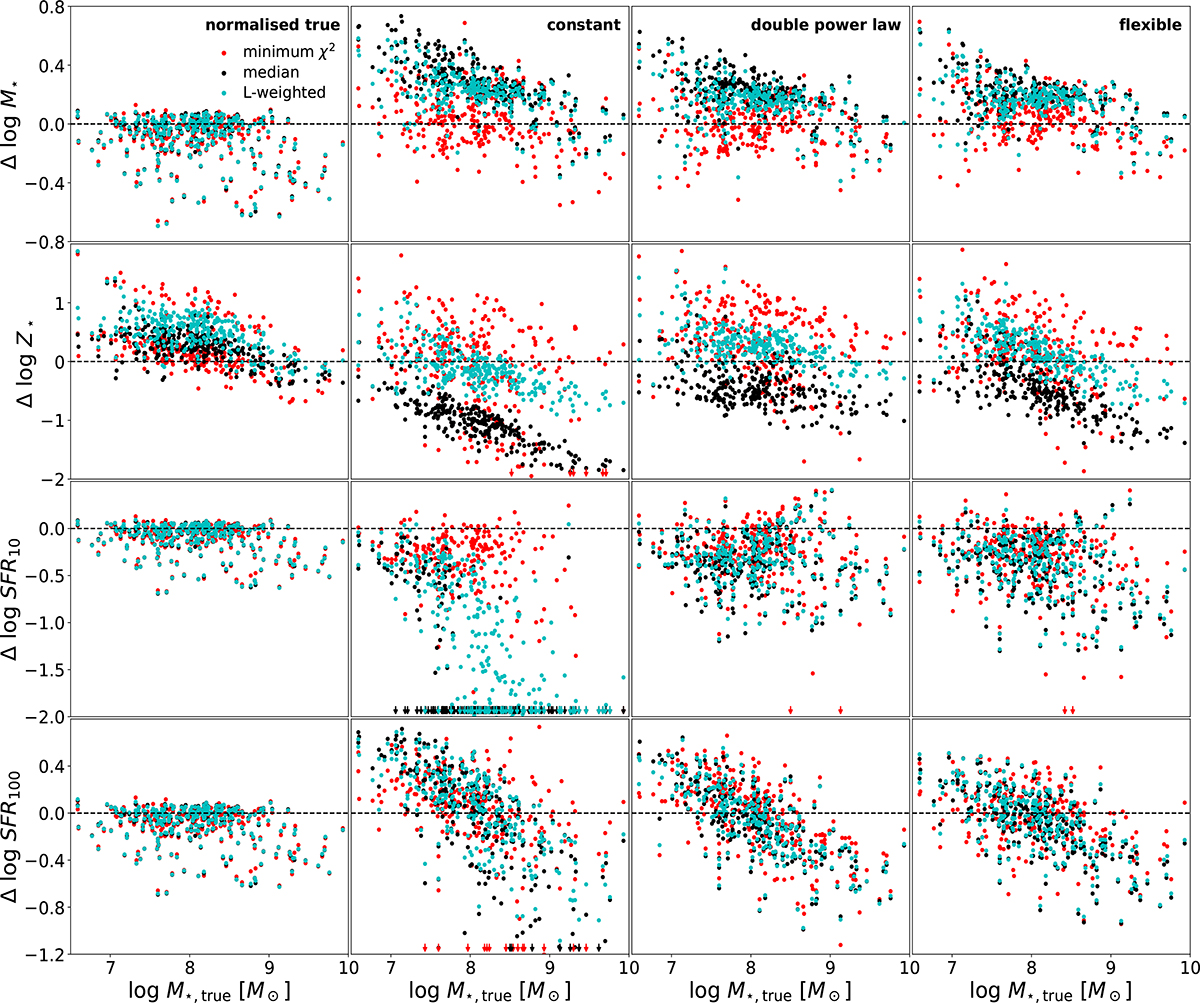
Download original image
Impact of summary statistics on the recovered physical quantities in the attSNE_Z_F410M model. Each row displays the difference between the true and fitted values of M★, Z★, SFR10, and SFR100, while each column corresponds to a different SFH model. The fitted values are derived from the posterior distribution using one of the three statistics: minimum χ2 (red), median posterior (black), or likelihood-weighted mean (cyan). The minimum χ2 posterior yields the most accurate recovery of M★, whereas the likelihood-weighted mean performs best for Z★. The recovered SFRs are generally insensitive to the choice of the summary statistic, except in the constant SFH model.
Current usage metrics show cumulative count of Article Views (full-text article views including HTML views, PDF and ePub downloads, according to the available data) and Abstracts Views on Vision4Press platform.
Data correspond to usage on the plateform after 2015. The current usage metrics is available 48-96 hours after online publication and is updated daily on week days.
Initial download of the metrics may take a while.