Fig. 2.
Download original image
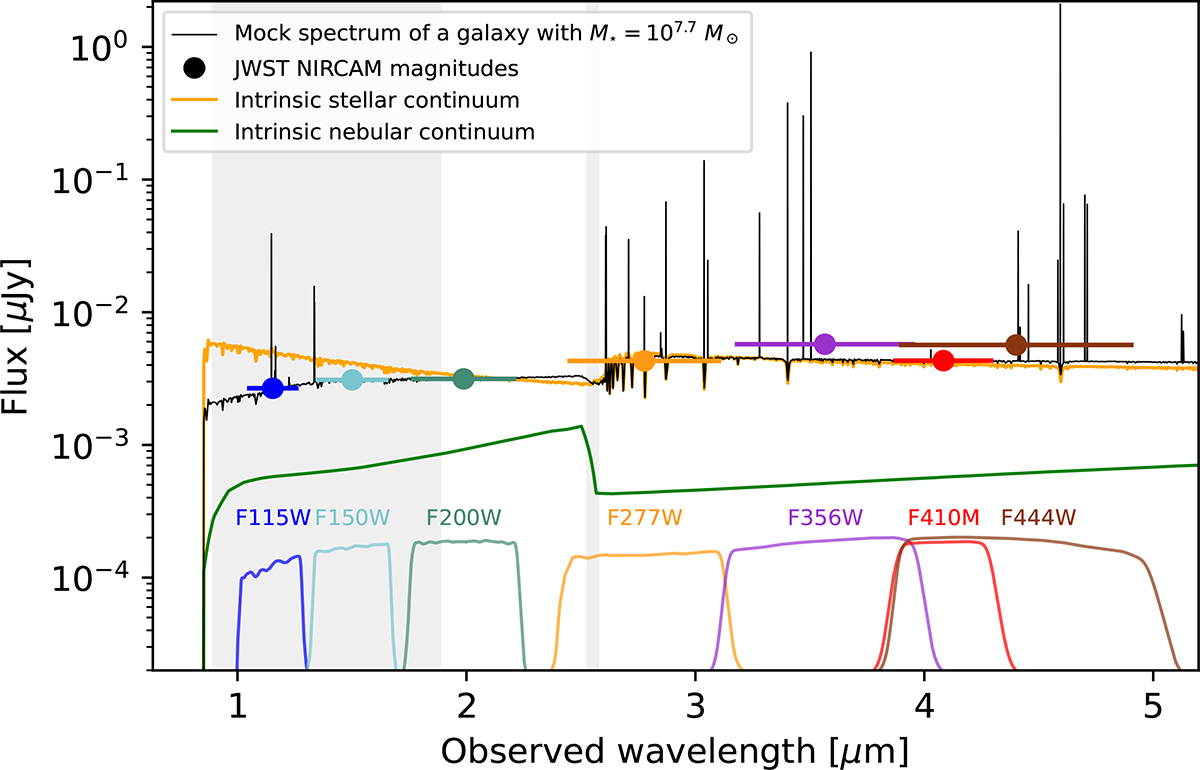
Example SED of a SPHINX20 galaxy at z = 6. The black line represents the attenuated spectrum along a random line of sight. Coloured points mark the pivot wavelengths and bandwidths of the seven JWST NIRCam filters, with corresponding throughput curves shown below. The orange and green lines indicate the intrinsic stellar and nebular continua, respectively. The shaded regions indicate the wavelength range used to measure the UV slope (β) and the position of the Balmer break, respectively.
Current usage metrics show cumulative count of Article Views (full-text article views including HTML views, PDF and ePub downloads, according to the available data) and Abstracts Views on Vision4Press platform.
Data correspond to usage on the plateform after 2015. The current usage metrics is available 48-96 hours after online publication and is updated daily on week days.
Initial download of the metrics may take a while.