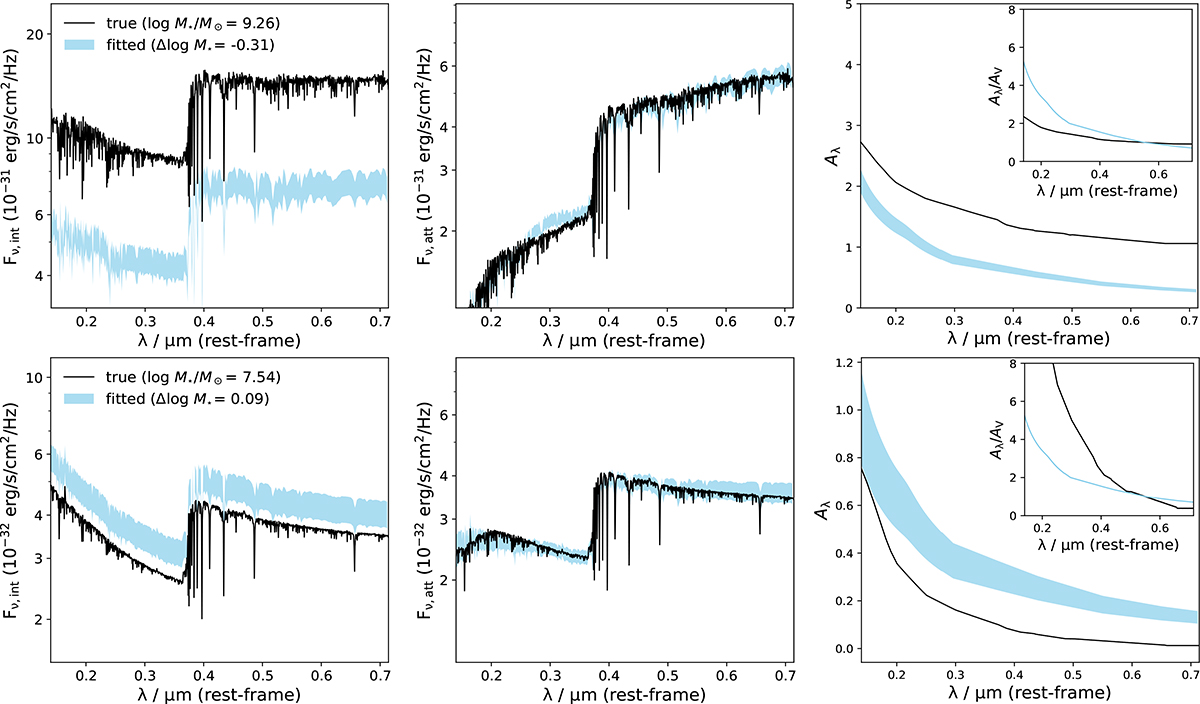
Fig. 8.
Download original image
16th–84th percentile range of the posterior SEDs (blue shaded regions) is shown for two example galaxies, together with their true attenuated SEDs (black lines). Stellar metallicities are fixed to the true mass-weighted values. The left and middle panels display the intrinsic and attenuated stellar continua, respectively, and the right panels show the attenuation curves, with insets presenting their normalised forms (scaled by AV). Here, Aλ is scaled to reproduce the attenuated SEDs while preserving the intrinsic SED shape (Υ(λ)). The galaxy in the upper panel has a flatter dust slope than the model, yielding a fitted AV lower than the true value, whereas the galaxy in the lower panel has a steeper dust slope, resulting in a fitted AV higher than the true value.
Current usage metrics show cumulative count of Article Views (full-text article views including HTML views, PDF and ePub downloads, according to the available data) and Abstracts Views on Vision4Press platform.
Data correspond to usage on the plateform after 2015. The current usage metrics is available 48-96 hours after online publication and is updated daily on week days.
Initial download of the metrics may take a while.