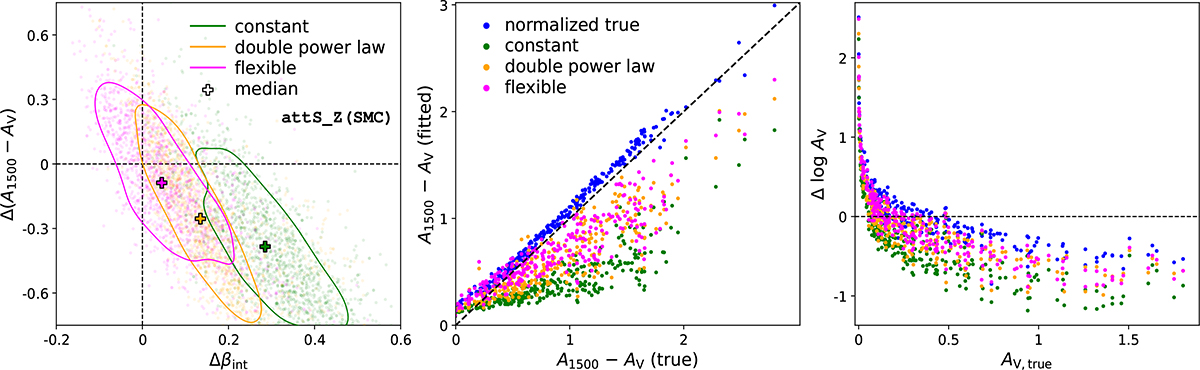
Fig. 9.
Download original image
Distribution of the difference between the fitted and true values of βint and the colour excess for a randomly selected galaxy, shown in the left panel. Crosses mark the medians, and contours enclose the 1σ confidence regions of the posterior distributions for each SFH model. A negative correlation is evident between the two quantities. Among the models, the constant SFH model yields the largest overestimation of βint, followed by the double power-law and flexible models. This trend appears in most galaxies in our sample, independent of the dust model adopted. The middle panel presents the resulting distribution of the recovered colour excess, while the right panel displays the distribution of the AV offset, which is directly related to the colour excess attributed to their positive correlation.
Current usage metrics show cumulative count of Article Views (full-text article views including HTML views, PDF and ePub downloads, according to the available data) and Abstracts Views on Vision4Press platform.
Data correspond to usage on the plateform after 2015. The current usage metrics is available 48-96 hours after online publication and is updated daily on week days.
Initial download of the metrics may take a while.