Fig. 10
Download original image
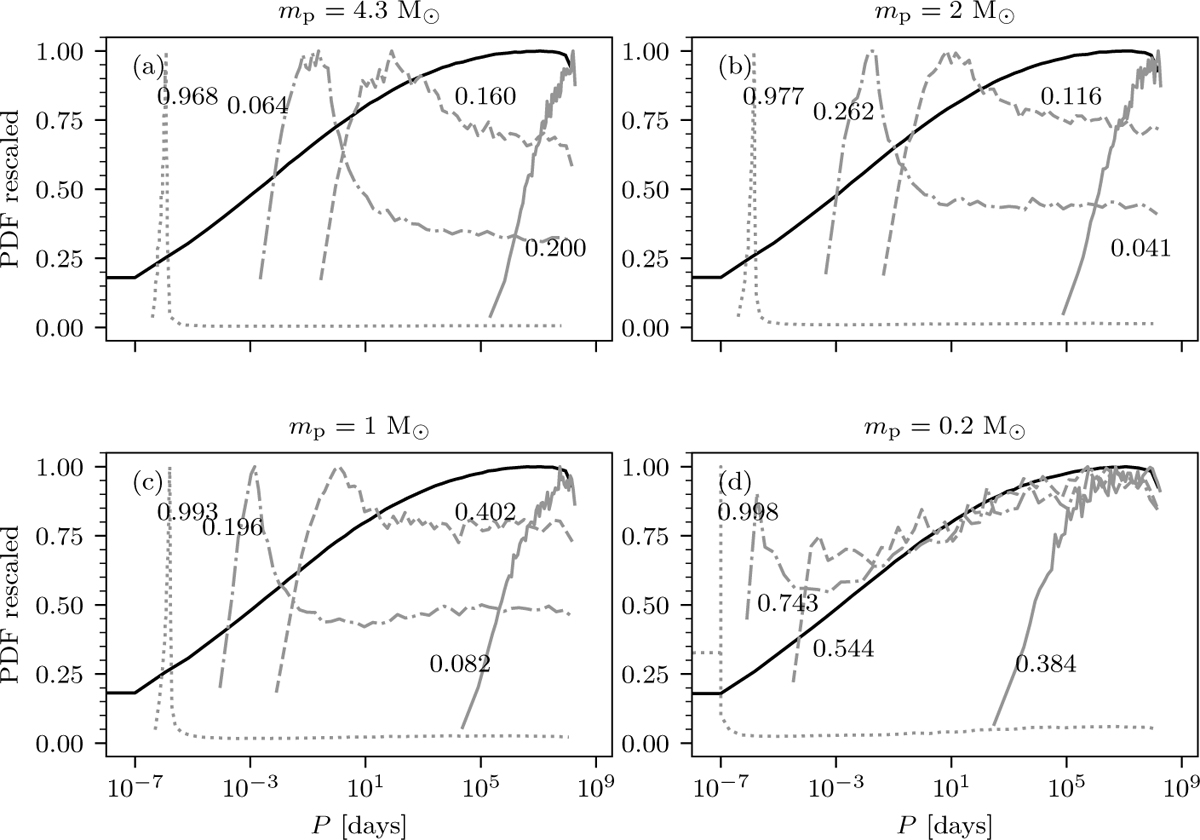
Initial (i.e. after pre-main sequence eigenevolution) period distributions for binaries with different mass ratios and primary masses. Each panel corresponds to a different primary mass (as indicated in the title). The black solid line shows the overall period distribution for that primary mass, while grey lines (with different styles) indicate distributions in individual q bins. The label next to each gray line denotes the left edge of the corresponding q bin; all bins have a fixed width of 0.001. All distributions are normalized to their peak values to facilitate visual comparison across different scales. We note that the extremely short orbital period appearing here (≈10−7 days, i.e. on the order of milliseconds) is unphysical. Such systems are rarely generated and would merge almost immediately after the start of the simulation.
Current usage metrics show cumulative count of Article Views (full-text article views including HTML views, PDF and ePub downloads, according to the available data) and Abstracts Views on Vision4Press platform.
Data correspond to usage on the plateform after 2015. The current usage metrics is available 48-96 hours after online publication and is updated daily on week days.
Initial download of the metrics may take a while.