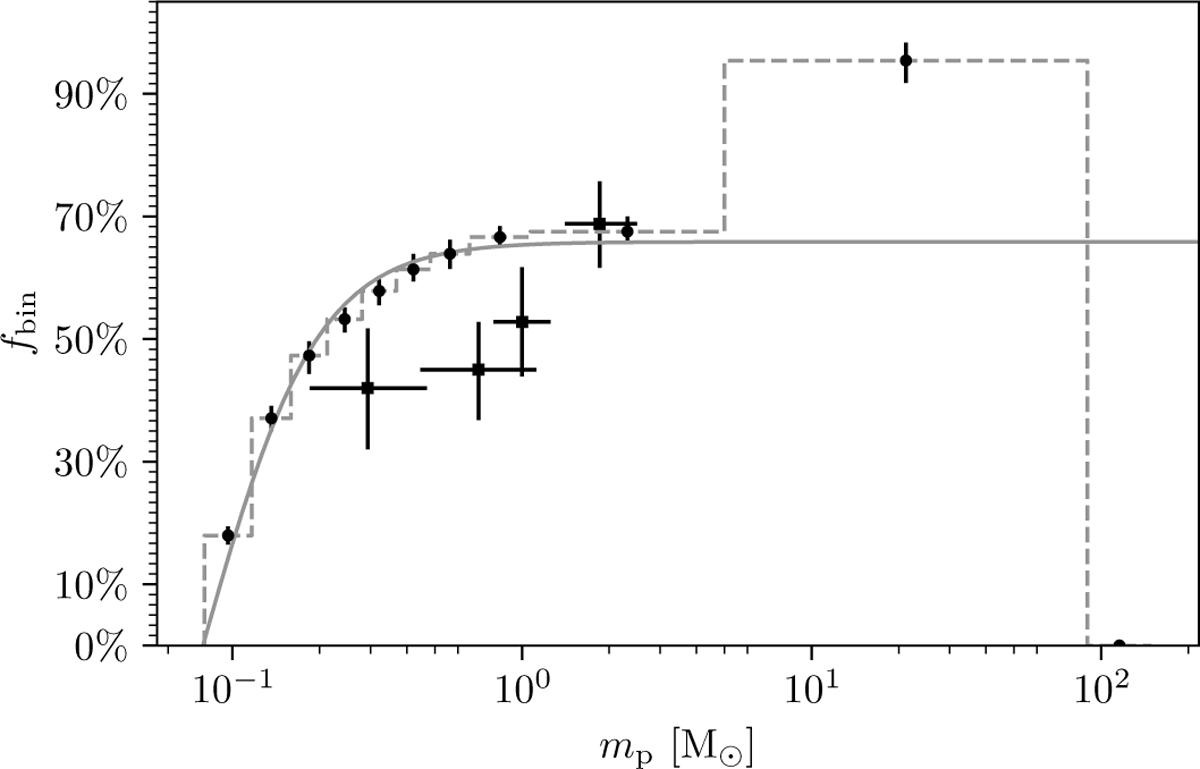
Fig. 11
Download original image
Binary fraction as a function of primary mass, mp. Points show the median across all samples, with error bars marking the 16th–84th percentile range. The dashed gray line indicates the binning scheme and median values. The last bin spans 89.73–149.17 M⊙; its upper edge corresponds to the most massive stars found in our models, which form through mergers and are therefore single. The solid gray curve shows the best-fit model obtained via maximum-likelihood estimation. Observational results are over-plotted as open squares: Kroupa et al. (2003) for M-, K- and G-type stars (left three points) and De Rosa et al. (2014) for A-type stars (right-most point). We note that all observational results come from the Galactic field.
Current usage metrics show cumulative count of Article Views (full-text article views including HTML views, PDF and ePub downloads, according to the available data) and Abstracts Views on Vision4Press platform.
Data correspond to usage on the plateform after 2015. The current usage metrics is available 48-96 hours after online publication and is updated daily on week days.
Initial download of the metrics may take a while.