Fig. A.1
Download original image
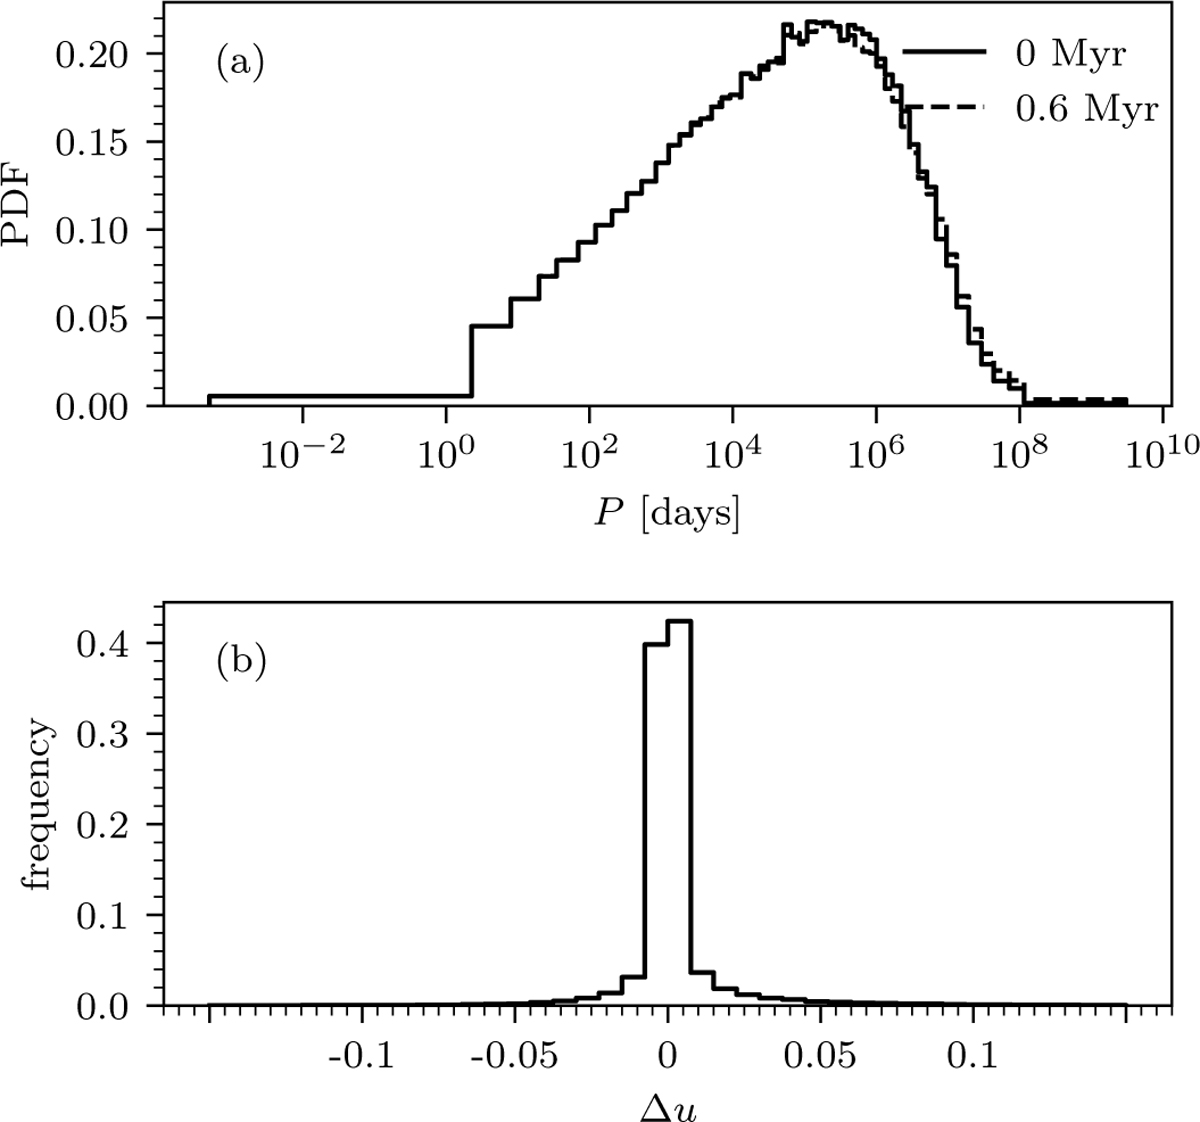
(a) Empirical PDFs of the period P for surviving binaries at 0 Myr (solid) and 0.6 Myr (dashed). The same binning is applied to all models, and the plotted histograms show, for each bin, the median value across all clusters. The two distributions are nearly indistinguishable. (b) Histogram of quantile shifts, where the bar heights represent the median values across all clusters.
Current usage metrics show cumulative count of Article Views (full-text article views including HTML views, PDF and ePub downloads, according to the available data) and Abstracts Views on Vision4Press platform.
Data correspond to usage on the plateform after 2015. The current usage metrics is available 48-96 hours after online publication and is updated daily on week days.
Initial download of the metrics may take a while.